Most people read the return figure first. That is natural. But the number that decides whether you can actually hold a strategy is not the return. It is the maximum drawdown.
What drawdown measures
Maximum drawdown (MDD) is the largest peak-to-trough fall in your account value.
drawdown = (current equity − running peak) / running peak
MDD      = the worst drawdown over the whole period
The reference point is the running peak, not your starting capital. If you start with $100,000, rise to $150,000, then fall to $90,000, you are down 10% from where you began but your drawdown is 40%. The second number is closer to what it actually felt like.
Losses and recoveries are not symmetric
This is the first reason to read drawdown before anything else. Losing 30% does not mean gaining 30% puts you back.
| Drawdown | Gain needed to break even |
|---|---|
| −10% | +11.1% |
| −20% | +25.0% |
| −30% | +42.9% |
| −50% | +100.0% |
| −70% | +233.3% |
| −90% | +900.0% |
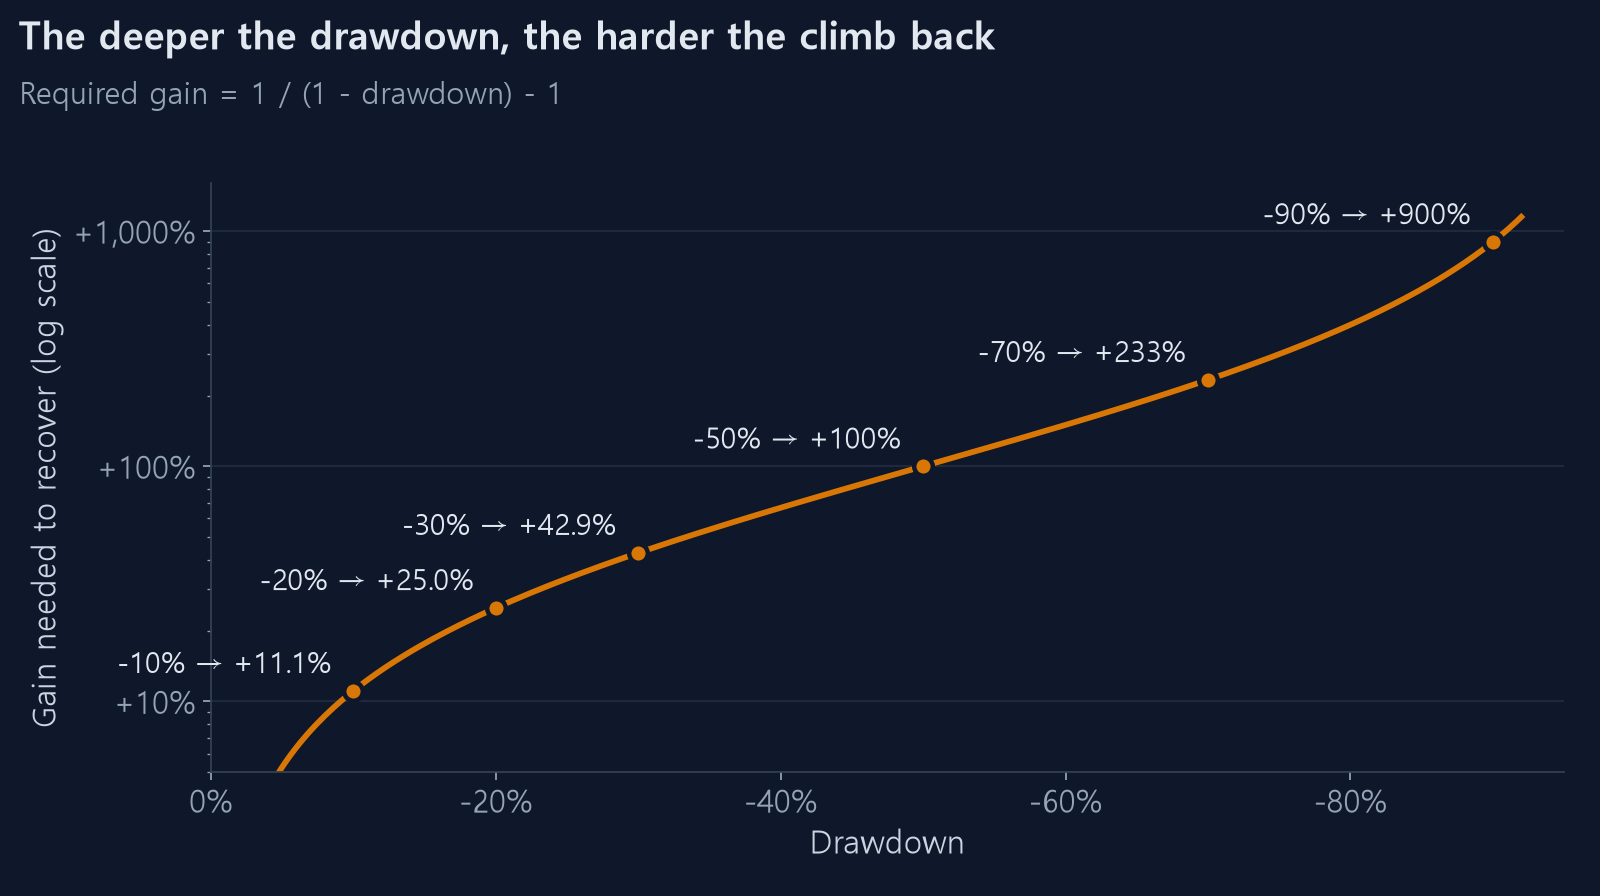
The stretch from −50% to −70% is especially brutal. The loss grows by 20 percentage points, but the recovery needed jumps from 100% to 233%. When a 3x leveraged ETF backtest shows a drawdown near −80%, that is closer to saying the strategy ended at that point than that it had a bad year.
Duration hurts more than depth
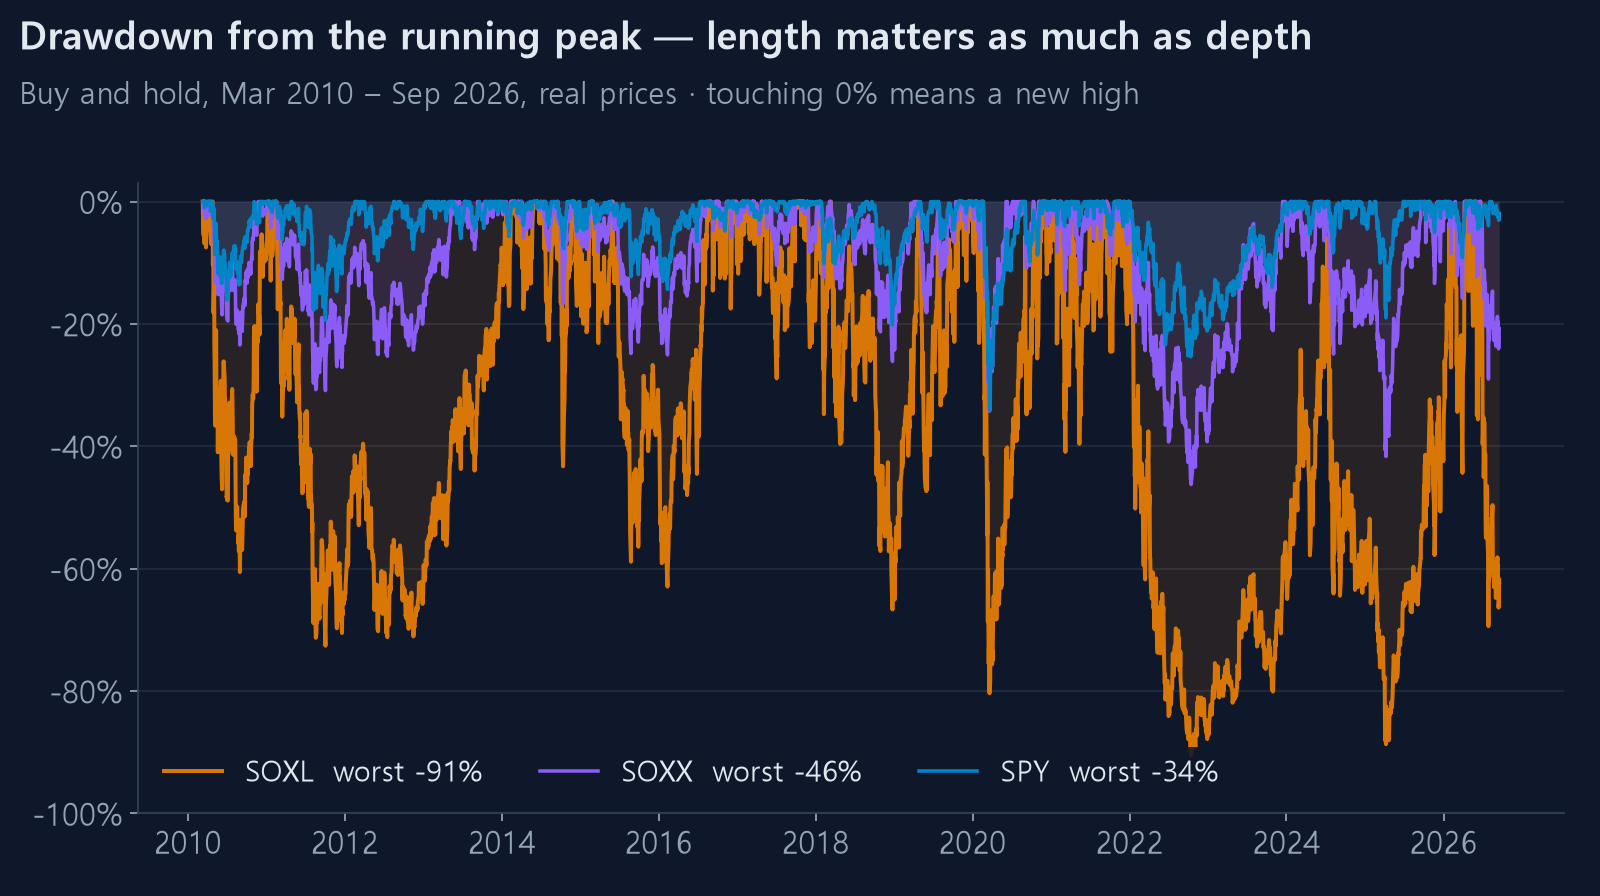
MDD is a single number, so it hides how long you were down there. A −35% drawdown that recovers in three months and a −35% drawdown that stays underwater for three years are completely different experiences.
This is called drawdown duration, and it is why you should always look at the equity curve rather than the summary table. A −35% figure reads calmly. A three-year flat valley on a chart does not.
People rarely abandon a strategy at the bottom. They abandon it much later, when the recovery still has not come.
The same strategy can show different drawdowns
Usually for one of these reasons.
Close versus intraday. Computing on daily closes misses deeper intraday lows. Most backtesting tools use closes, so your real drawdown is somewhat worse than reported.
Where the curve starts. Whether the equity curve begins at your initial capital or at the first trading day's close decides whether early losses are counted.
The window you chose. Starting in 2010 excludes the 2008 crisis. Starting in 2020 includes the COVID crash but also the extraordinarily fast recovery that followed. Drawdown grows with observation length. A low MDD over a short window often just means you did not live through a crisis.
Reading it alongside returns
On drawdown alone, holding cash is the best strategy in history. So it is paired with return.
Calmar ratio = annualised return ÷ absolute drawdown
A strategy returning 20% a year with a −40% drawdown scores 0.5. One returning 12% with a −15% drawdown scores 0.8. The second earns less but is more efficient per unit of pain.
Above 1.0 is good. Above 3.0 usually means the window was short or the strategy is overfitted.
What to check
When comparing strategies, work in this order.
- Is the drawdown survivable for me? Do not read it as a number. Picture the actual amount shrinking. Can you watch $100,000 sit at $60,000 for three years?
- How long is the valley? Length exhausts people more than depth does.
- Is drawdown lower than buy-and-hold? If returns rose but drawdown did not fall, you have effectively just added leverage.
- Is performance concentrated in one year? If a single year produced all the gains, that is more likely luck than strategy.
Returns make a strategy attractive. Tolerable drawdown is what lets you keep holding it. If you cannot stomach −60% in a backtest, you certainly cannot in a live account.