A backtest gives you two return figures: total return and compound annual growth rate. Same strategy, same period, very different numbers. Which one should you trust?
Definitions
Total return is how much the account grew from start to finish.
total return = (final equity − initial equity) / initial equity
CAGR (compound annual growth rate) converts that into a constant yearly rate.
CAGR = (final equity / initial equity)^(1 / years) − 1
Doubling your money over ten years is a total return of +100% but a CAGR of about 7.2%. Compounding at 7.2% for ten years lands exactly on a double.
Total return hides the clock
"This strategy returned 300%" tells you nothing on its own. Over three years that is 59% a year. Over twenty years it is 7.2%. Quoting total return without the period is close to saying nothing at all.
Whenever periods differ, compare CAGR.
The arithmetic mean trap
This matters more. Returns multiply, they do not add.
Year one is +50%, year two is −50%. The average is 0%, so you would expect to be flat.
$10,000 × 1.5 = $15,000
$15,000 × 0.5 =  $7,500
You are down 25%. The arithmetic mean says zero; the actual outcome is a loss.
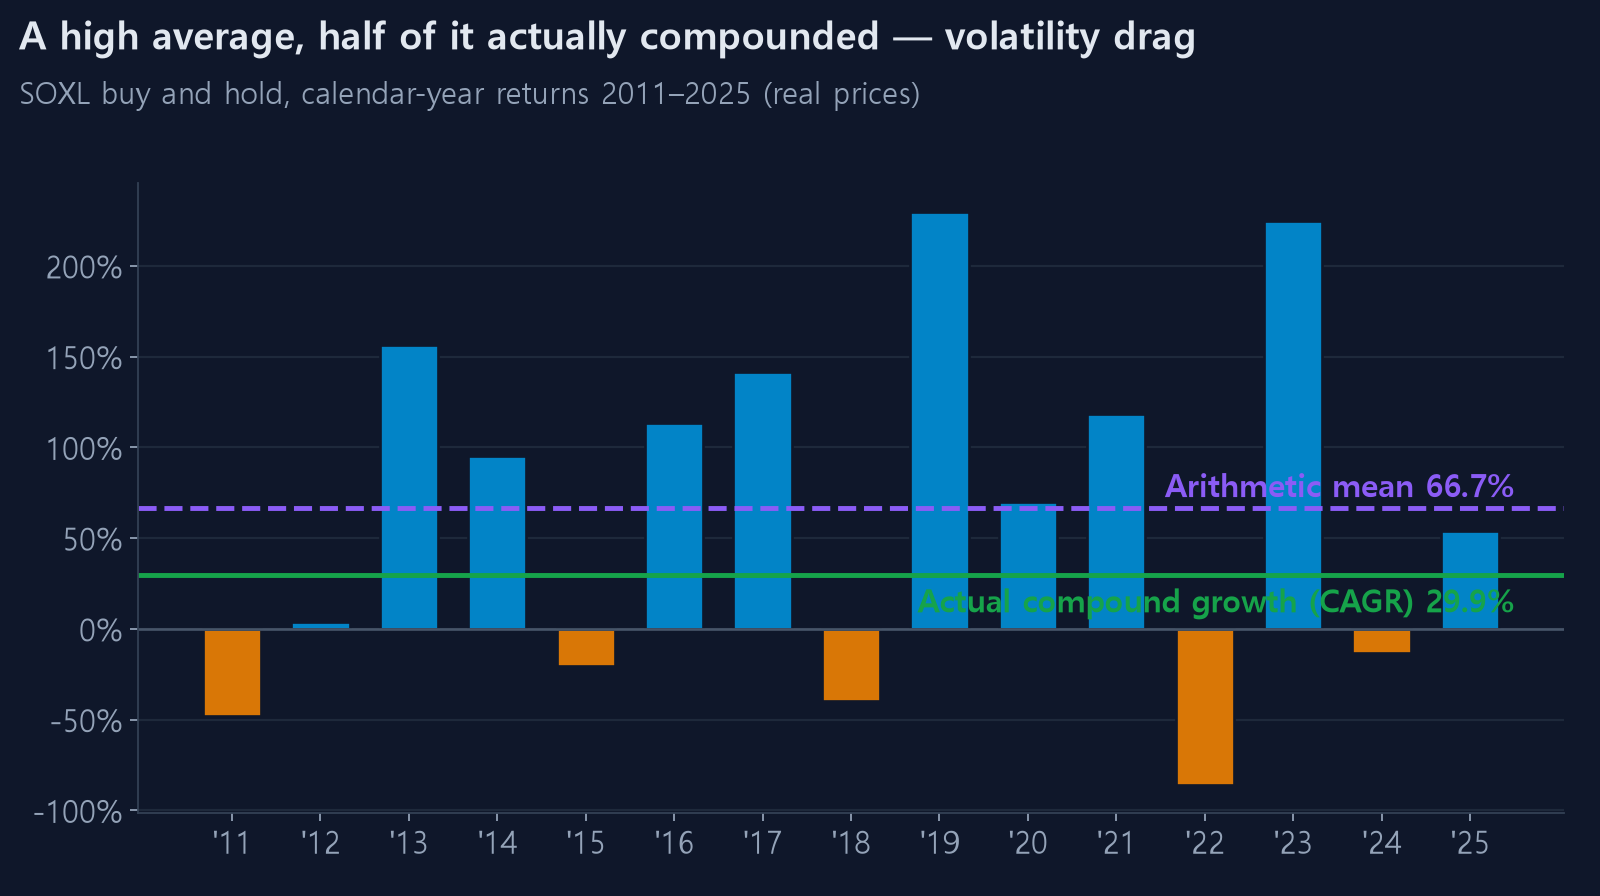
This gap is called volatility drag. The more the path swings, the further the real compounded result falls below the simple average. Roughly:
CAGR ≈ arithmetic mean − (variance / 2)
Higher volatility subtracts more. This is how an asset that goes up "on average" can still lose money over a long hold.
Leveraged ETFs make this extreme
A 3x fund tracks three times the daily return, not three times the long-run return. Combine that with volatility drag and the result stops matching intuition.
Suppose the underlying rises 10%, then falls 9.09%, returning exactly to where it began.
| Underlying | 3x fund | |
|---|---|---|
| Day 1 | +10% | +30% |
| Day 2 | −9.09% | −27.27% |
| Net | 0% | −5.45% |
The underlying is flat and the leveraged product lost over 5%. In a long sideways market this bleed keeps accumulating. It explains most cases where a SOXL or TQQQ backtest disappoints even though the underlying index rose.
In a sustained one-way rally the same mechanism works the other way and the fund beats 3x. Leveraged products are sensitive to path, not just direction.
Start and end dates move the number a lot
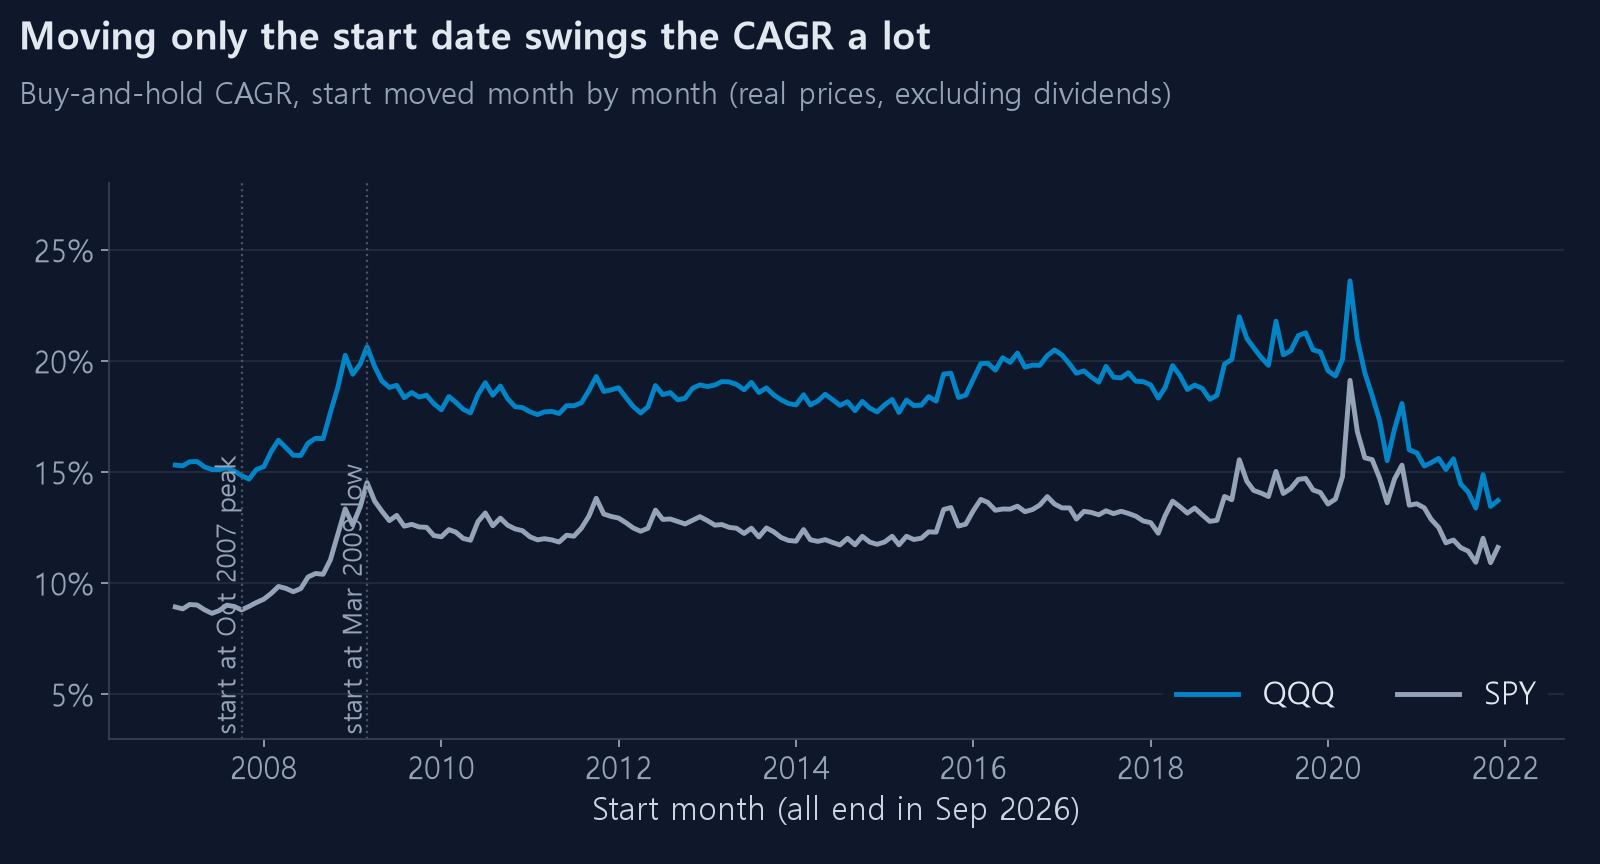
CAGR uses only two endpoints, so shifting either one swings the result.
Measure from the March 2020 low and almost any strategy looks brilliant. Measure from the late-2021 peak and the same strategy looks broken. This is why you should never judge a backtest on a single window.
Three checks:
- Shift the start date by three months in both directions and see how much moves
- Break results out by year and look for concentration
- Make sure a real decline is inside the window (Q4 2018, March 2020, all of 2022)
If one year produced most of the gains, you may be measuring that year's asset rather than your strategy.
Summary
- Compare strategies over different periods using CAGR
- Use total return to feel the actual money
- Average returns geometrically, never arithmetically
- The more volatile the asset, the wider the gap between the two
- Never read CAGR without reading maximum drawdown next to it