Recalculated 2026-10-19 — the way index-based SOXL is built has changed since this article was first written (2026-09-20; see section 1). All dual-mode and buy-and-hold numbers were rerun with the current engine and the new data. As a result, the original headline finding — "dual-mode actually made money in 2008 (+75%)" — does not reproduce on the current data (the same original D4 loses 57% in 2008). The change comes from a mix of the 2001–2009 1x source (the first version used ^SOX only; now SOXX) and later changes to the dual-mode engine; the 2026-10-19 fixes to the dividend estimate and the seam day do not change any number after July 2001. The ladder strategies (S1–S4) can no longer be recalculated because their engine has been removed from the site, so their figures remain only as a record from the old data, shown in italics. Names such as S1–S4 and R1 are from the time of the research and are not in the current strategy list (A, D, B, G and I families). See the strategy guide for the current ones.
However far back you run a SOXL backtest, it stops at 2010, the year SOXL listed. And 2010–2026 happened to be the best stretch in semiconductor history. Simply holding SOXL averaged +71% a year.
So is the great-looking backtest a good strategy, or a good era? The only way to find out is to run it through bad eras: the dot-com bust (2000–2002) and the financial crisis (2008).
1. Bringing SOXL back to 1996
SOXL aims for three times the daily return of a semiconductor index. So taking the daily return of a 1x semiconductor series × 3, minus the expense ratio and the cost of borrowing for leverage, gives an index-based SOXL. The site currently builds it like this:
- 1x source — from 1994 to June 2001, the PHLX Semiconductor Index (^SOX; a price index, so an estimated 0.2%/yr dividend yield is added back); from July 2001, the 1x semiconductor ETF SOXX with dividends reinvested. Note that until October 2010 SOXX was called IGW and tracked the S&P GSTI Semiconductor Index, a similar chip index rather than ^SOX itself (daily correlation about 0.97).
- Costs — 0.75%/yr expense ratio + borrowing cost (2 × the 13-week T-bill rate) + a 2.33%/yr tracking cost. The last term is set so that, over the years after 2010 where real SOXL exists, the index-based return matches the real one.
Overlaid on real SOXL for 2010–2026:
| Comparison (2010–2026) | Value |
|---|---|
| Daily return correlation | 0.997 |
| Yearly return correlation | 0.999 |
| Annual return (real / index-based) | 37.3% / 37.3% (matched by the tracking cost) |
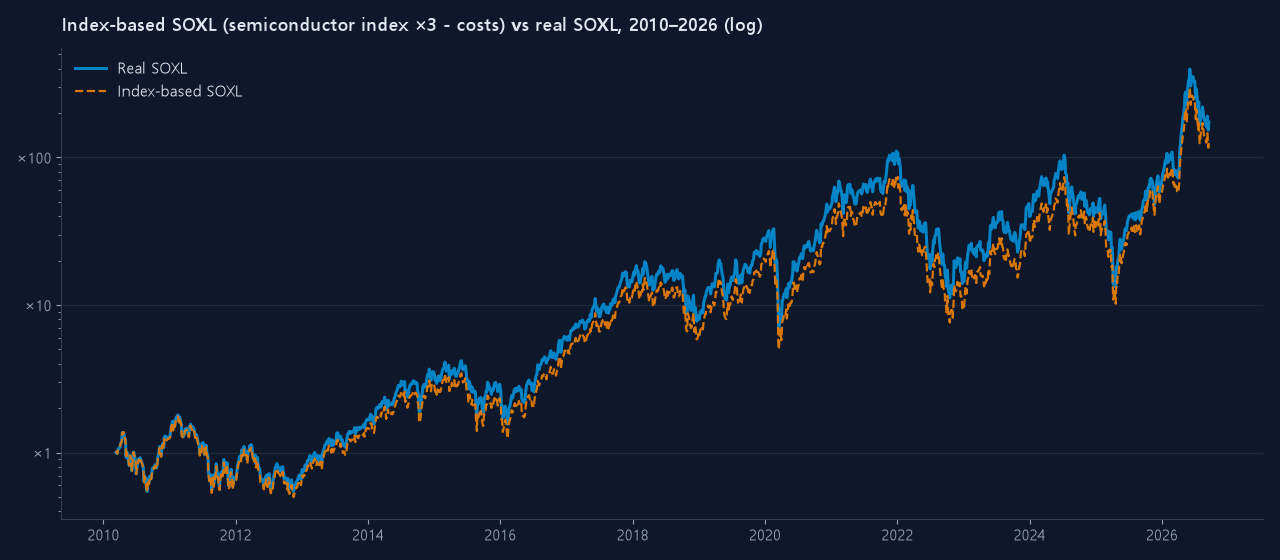
The charts in this article were drawn from the old (2026-09-20) index-based data, so they differ slightly from the tables.
How far to trust it (checked 2026-10-19): day-to-day closing moves are reliable. Against the semiconductor products that actually traded in 2001–2010 (the 2x ETF USD and a 1.5x fund), the daily correlation was 0.97, and the 2008 drawdown at 3x came out at −94.5% index-based versus −93.5% to −94.2% backed out of the real products. Opening and intraday prices are much weaker (1997–2001 has almost no real opening prices). And the dividend and borrowing assumptions lean slightly favourable, so pre-listing results may be 1–2 points a year optimistic.
2. Holding SOXL for 30 years: −92%
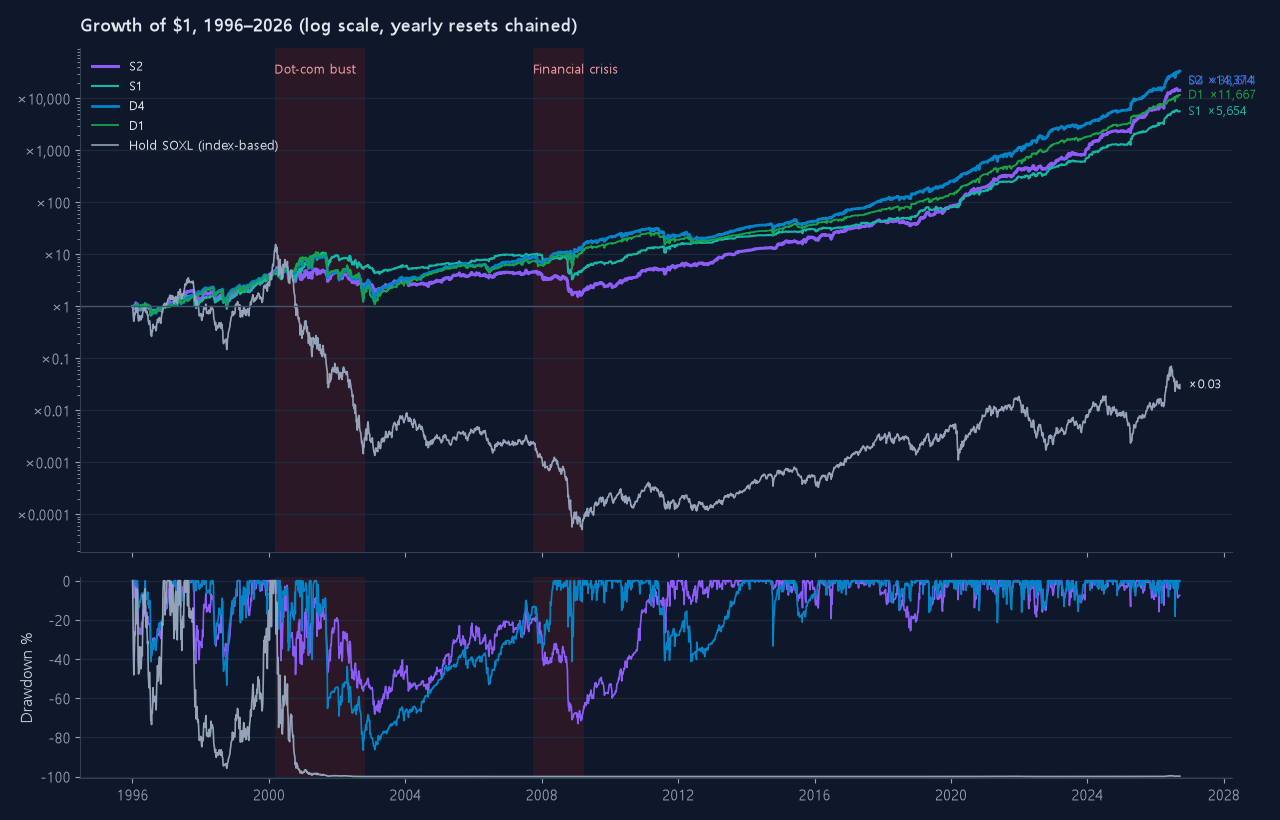
The grey line is buying SOXL in 1996 and holding.
- March 2000 → October 2002: −99.99%. Buy at the top of the bubble and $100,000 becomes $10.
- July 2007 → November 2008: −98.2%.
- Thirty years later (2026-10-16) it is still at 7.6% of the starting capital. Hundreds-fold gains after 2010 could not repair what was lost before.
The original dual-mode strategies (D1–D5) survived the same years, and chaining their yearly results turns $1 into $630–$1,400. Run continuously through 1996–2009 without the January restart, though, they compounded at 8–12% a year with maximum drawdowns of −87% to −93%. Splitting entries and switching modes beats simply holding, but in bad eras it was not enough to contain 3x leverage on its own.
3. Split by era
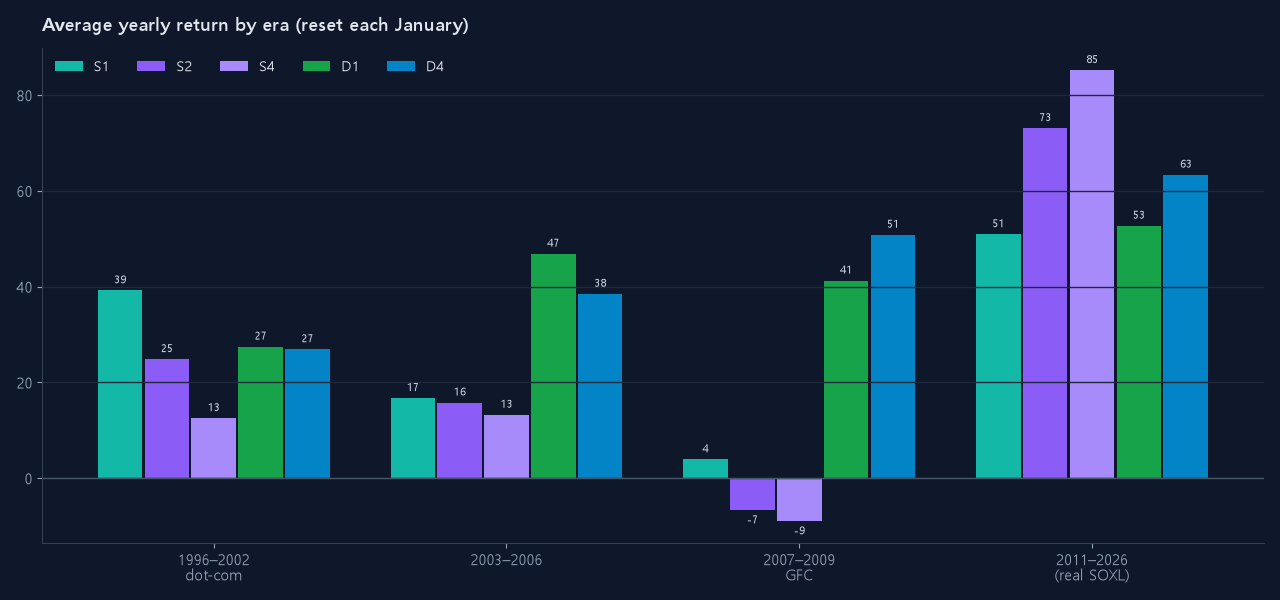
| Strategy | 1996–2002 (dot-com) | 2003–2006 | 2007–2009 (GFC) | 2011–2026 (real) | 1996–2009 continuous MDD |
|---|---|---|---|---|---|
| S1 Low drawdown (old record) | 39.2% / −39.4% | 16.7% / −14.9% | 3.9% / −30.4% | 50.9% / −10.3% | −72% |
| S2 Ensemble-3 (old record) | 24.9% / −41.6% | 15.8% / −25.0% | −6.6% / −33.3% | 73.1% / −14.6% | −73% |
| S3 Ensemble-4 (old record) | 28.5% / −41.4% | 16.8% / −22.5% | −4.3% / −34.3% | 69.0% / −13.3% | −72% |
| S4 High return (old record) | 12.5% / −45.4% | 13.2% / −31.4% | −8.9% / −36.6% | 85.2% / −18.1% | −88% |
| D1 6 tranches −0.1% | 26.7% / −44.6% | 31.4% / −24.0% | 8.5% / −39.9% | 45.6% / −18.7% | −87% |
| D2 6 tranches +0.5% | 27.4% / −44.6% | 27.3% / −24.1% | 4.6% / −39.9% | 45.4% / −20.5% | −88% |
| D3 5 tranches +0.5% | 30.0% / −45.9% | 24.7% / −26.6% | 7.4% / −41.4% | 50.8% / −22.9% | −90% |
| D4 7 tranches +8% | 24.8% / −45.6% | 22.0% / −26.7% | 8.8% / −38.9% | 52.0% / −20.6% | −92% |
| D5 6 tranches +8% | 26.1% / −47.9% | 23.9% / −28.1% | 9.5% / −41.4% | 57.0% / −22.6% | −93% |
Each cell is average yearly return / average yearly MDD, restarting every January. The last column is the maximum drawdown when 1996–2009 is run continuously. D1–D5 here are the original rules (before the site's current improved versions), rerun with today's engine. The S rows come from the old data and old engine and should not be compared directly with the D rows.
Three things stand out.
- Before and after 2010 were different games. Run continuously through 1996–2009, the original dual-mode strategies compounded at 8–12% a year; after 2011 they average 45–57%. A large part of today's numbers is the era.
- The higher-return settings dug deeper holes in bad eras. D5, the best since 2011 (57%), had the deepest continuous 1996–2009 drawdown (−93%); D1, the lowest since 2011, had the shallowest (−87%).
- The dot-com years were positive year by year, but the holes were deep. For 1996–2002 the average year returned 25–30%, yet the average yearly drawdown was −45% to −48%, more than twice the post-2011 range (−19% to −23%). The financial crisis (2007–2009) averaged only 5–10% a year — unlike the original article (+40% to +52%), it was not a period where dual-mode held up especially well.
Why fractional shares Index-based SOXL is a 3x index wound backwards, so its price level is extreme: one share costs about $22,000 in March 2000 and $0.14 in February 2009. A real ETF would have split its shares to stay in a normal range; a reconstructed series never does. Apply a whole-share rule to a $10,000 account on that series and most tranches before 2001 cannot buy even one share — rounding, not the strategy, decides the result. So the site computes the index-based stretch with fractional shares, and so does this article.
4. Year by year
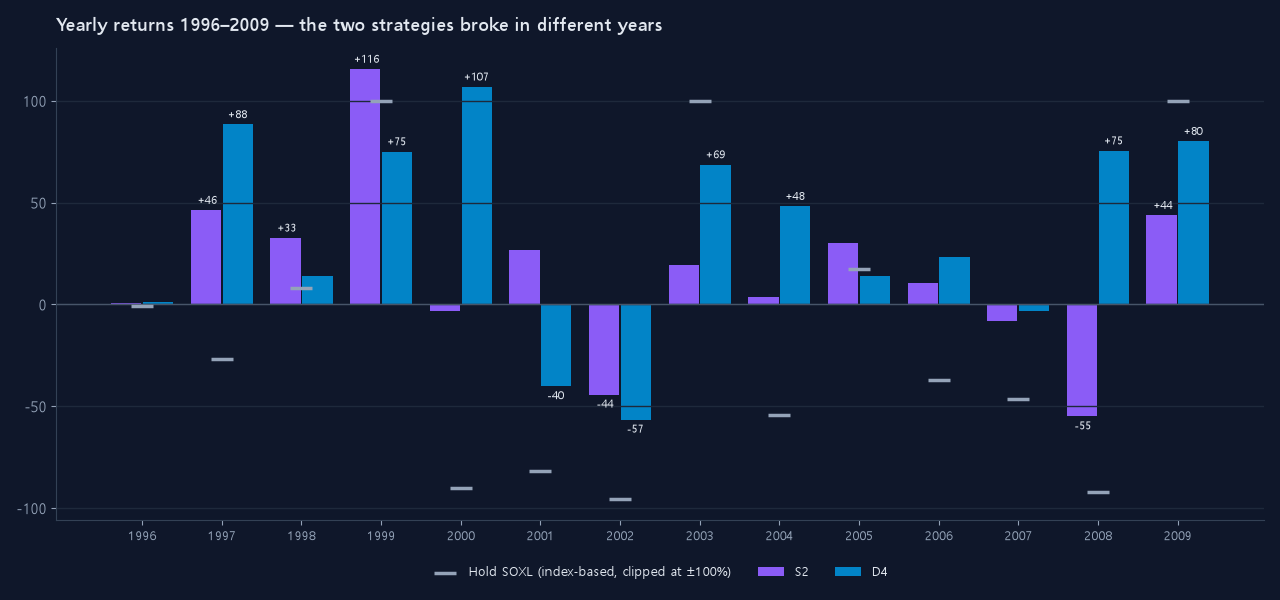
| Year | S2 Ensemble-3 (old record) | D4 7 tranches +8% (original) | Hold SOXL (index-based) |
|---|---|---|---|
| 2000 | −3% | +106% | −90% |
| 2001 | +27% | −32% | −79% |
| 2002 | −44% | −64% | −96% |
| 2003 | +19% | +96% | +270% |
| 2008 | −55% | −57% | −95% |
| 2009 | +44% | +70% | +237% |
- Dot-com bust (2000–2002): a decline lasting more than two years, broken by sharp rallies. Dual-mode, which switches between attack and defense on the weekly RSI, gained 106% in 2000 and then gave back 32% and 64% in the next two years.
- Financial crisis (2008): a crash and a rebound packed into one year. The original article had dual-mode up 75%; on the new data D4 also lost 57%. 2008 is a year that swings heavily with which 1x semiconductor series is used for 2001–2009 (switching to a different chip ETF moves the same strategy's 2008 result by tens of points).
5. Mixing with the ladder 50:50 — the old conclusion no longer holds
The original article relied on S2 (ladder) and D4 (dual-mode) having different worst years — above all 2008, S2 −55% and D4 +75% — and concluded that a 50:50 mix cut losing years from five to three and produced the largest 30-year growth (×39,832).
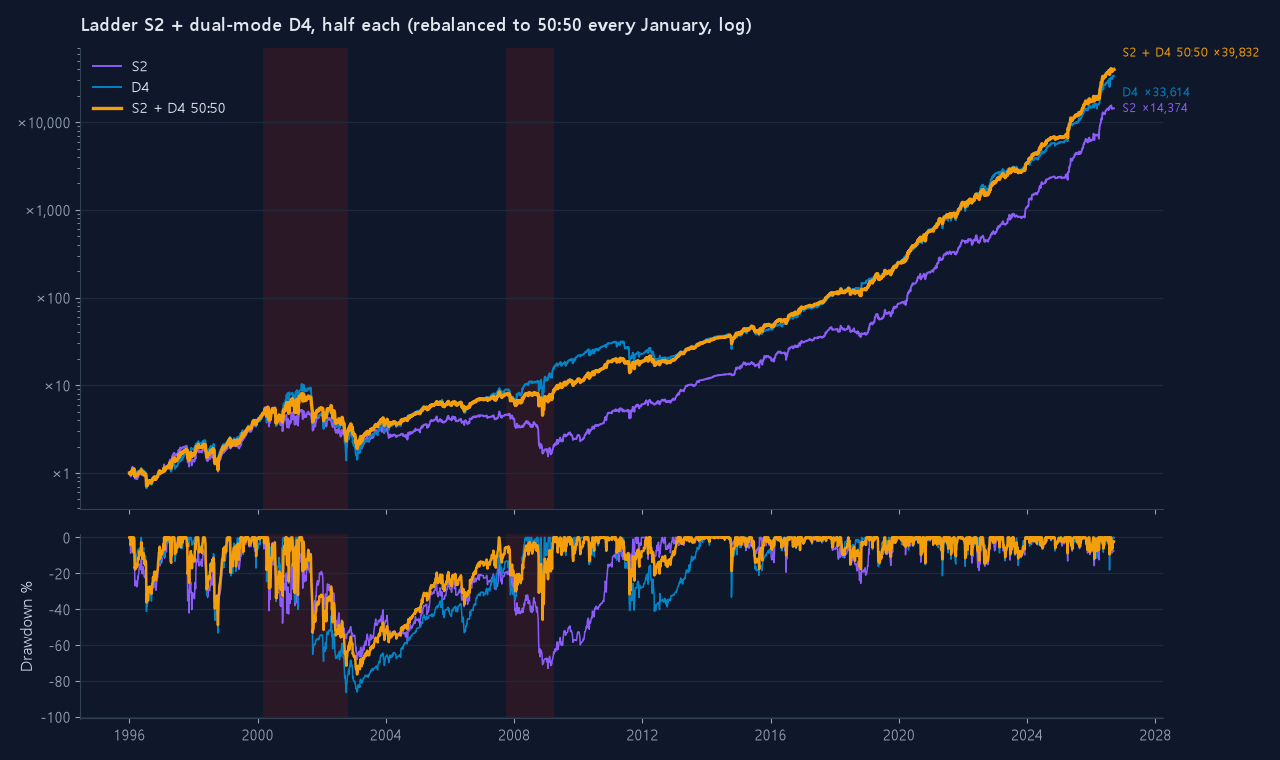
On the new data the original D4 also loses 57% in 2008, so the key support for that conclusion — one side covering for the other in 2008 — is gone. S2's engine has been removed, so the mix cannot be recalculated; please treat the 50:50 conclusion as unsupported. For reference, the original D4 alone on the new data averages 37.3% a year with an average yearly MDD of −29.1% over 30 years (1996–2009 and 2011–2026), eight losing years and ×1,017 chained growth (original article: 49.9% / −26.5%, five, ×33,614).
6. Today's site strategies on the same data
The same new data and method, applied to three close-based strategies on the site today:
| Strategy | 1996–2002 | 2003–2006 | 2007–2009 | 2011–2026 (real) | 1996–2009 continuous |
|---|---|---|---|---|---|
| A2 Standard | 19.0% / −41.0% | 27.9% / −21.7% | 32.9% / −27.2% | 31.9% / −21.7% | 18.2%/yr, MDD −61% |
| D4 7 tranches +8% (current) | 48.3% / −26.5% | 17.7% / −23.6% | 12.9% / −18.0% | 43.3% / −17.9% | 33.4%/yr, MDD −41% |
| D6 6 tranches +8% bear guard | 33.8% / −29.9% | 22.1% / −24.0% | 31.8% / −18.2% | 50.9% / −19.0% | 26.4%/yr, MDD −40% |
The first four columns are average yearly return / average yearly MDD, restarting with $10,000 every January; the last column runs $1,000,000 continuously. Commission 0.1% each way.
- The current improved versions cut the continuous 1996–2009 drawdown from −87% to −93% down to −40% to −61%. But those versions were tuned while also looking at the index-based years, so this table is not a clean out-of-sample test.
- In 2008 alone: A2 +6%, D4 −6%, D6 +11% — small enough that the choice of 1x source for that stretch (SOXX versus another chip ETF) can flip the sign.
- The 1996–2009 figures can move by 1–2 points a year with the index-based assumptions (dividends, costs, index differences).
Summary
- Holding SOXL from 1996 would leave 7.6% of the starting capital today (−92%). Held long enough, 3x leverage goes to nearly zero in a single crash.
- The original dual-mode strategies survived 30 years, but run continuously before 2010 their drawdowns reached −87% to −93%. Without the January restart, that stretch would have been hard to sit through.
- The higher-return settings dug the deepest holes in bad eras.
- The original findings that "dual-mode made money in 2008" and "a 50:50 mix with the ladder cuts losing years" are not confirmed on the new data.
- The 30–57% a year you see in SOXL backtests today are numbers from a good era. When setting expectations for the next ten years, keep the 1996–2009 numbers in mind as well.
Method notes: index-based SOXL = 1x source daily return × 3 − (0.75% expense ratio + 2 × 13-week T-bill yield + 2.33% tracking cost) ÷ 252. The 1x source is ^SOX (plus an estimated 0.2%/yr dividend) from May 1994 to 2001-07-12, then SOXX with dividends reinvested from 2001-07-13 to 2010-03-10 (named IGW and tracking the S&P GSTI Semiconductor Index until October 2010). SOXL has tracked a different semiconductor index (ICE) since 2021, so it differs slightly from ^SOX. Commission 0.1% each way; the index-based stretch uses fractional shares. Recalculated on 2026-10-19 with the current engine and new data (the earlier version used older index-based data built from ^SOX alone with a 0.95% fee). The ladder (S1–S4) figures are an old record that could not be recalculated because the engine was removed. Growth multiples ignore taxes and realistic capacity limits. This is not investment advice, and past results do not guarantee future returns.