Note — strategy names such as S1–S4 and R1 in this article are from the time of the research and are no longer in the site's strategy list (A, D, B, G and I families). See the strategy guide for the current ones.
Your backtest came back with a good number. Should you believe it?
This article shows how a strategy we built ourselves collapsed under validation. That is far more useful than criticising someone else's.
The strategy in question
Measuring performance by Fed policy regime on SOXL, 2010–2026, the pattern looked clean. Annualised returns:
| Hiking | Holding | Cutting | |
|---|---|---|---|
| S1 stable | 54.6% | 39.6% | 78.5% |
| S2 ensemble | 24.7% | 62.0% | 197.8% |
S1 wins while rates rise; S2 wins everywhere else. The obvious move is "run S1 when the Fed hikes, S2 otherwise." We called it R1. (It no longer exists on this site. Why we removed it is what this article is about.)
The result was excellent.
| CAGR | Max drawdown | Calmar | Losing years | |
|---|---|---|---|---|
| R1 (regime switch) | 71.8% | −23.9% | 3.01 | 0 |
| S2 fixed | 65.1% | −42.9% | 1.52 | 2 |
| S1 fixed | 49.6% | −21.9% | 2.27 | 0 |
| Buy and hold | 37.5% | −87.9% | — | 5 |
Higher return than S2, roughly half the drawdown, and not a single losing year. Stop here and you have discovered a great strategy.
Check one: is it looking at the future?
The first thing to suspect is lookahead — using data from after the decision point to make the decision.
R1 was clean. The regime comes from "today's rate versus the rate 126 sessions ago", and the underlying strategies only read indicators through the prior close. Technically there is nothing wrong with it.
It is still untrustworthy, for a different reason.
Check two: when did you decide the rule?
Here is the real problem. We chose "S1 during hikes" after seeing the full 2010–2026 result. Someone standing in 2015 could not have known that rule.
This is in-sample selection bias. It is harder to spot than lookahead and far more common, because no line of code ever reads a future value.
Walk-forward testing
The honest test is to re-choose the rule at every point using only the data available at that point.
Applied to R1:
- A hiking regime begins. No hiking history exists yet → fall back to the default, S2
- That regime ends. Record how each strategy did
- The next hiking regime begins. Choose using only hiking history so far
- Repeat
The result:
| CAGR | Max drawdown | Calmar | |
|---|---|---|---|
| R1 (chosen with hindsight) | 71.8% | −23.9% | 3.01 |
| Walk-forward | 67.5% | −31.4% | 2.15 |
| S2 fixed | 65.1% | −42.9% | 1.52 |
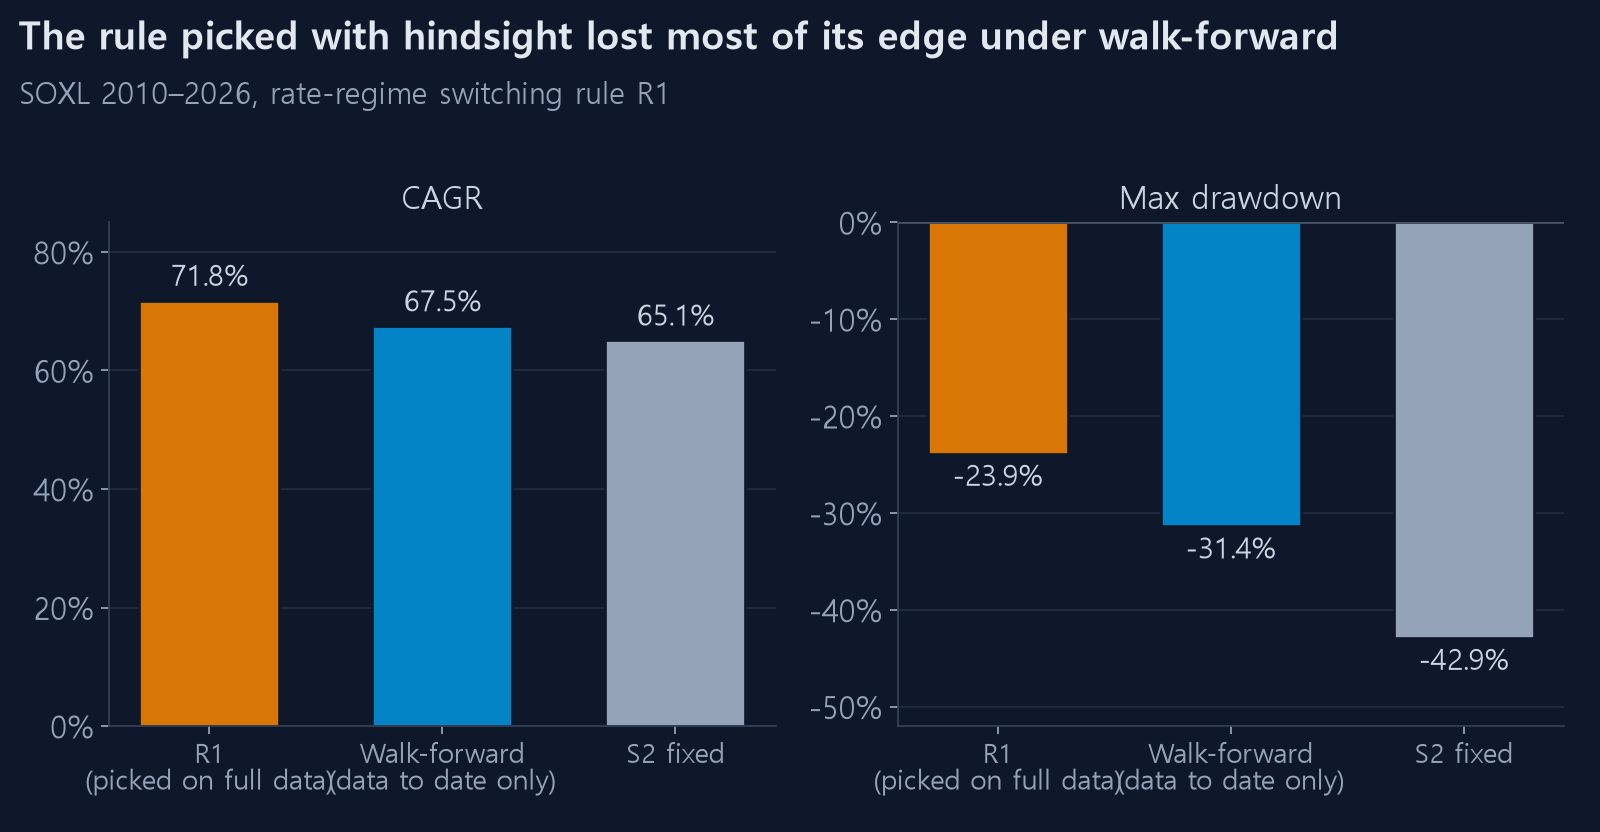
Most of the edge is gone. But the number matters less than what the walk-forward actually chose:
| Regime start | Regime | Choice |
|---|---|---|
| 2015-12 | Hiking | S2 |
| 2016-12 | Hiking | S2 |
| 2017-12 | Hiking | S2 |
| 2022-03 | Hiking | S1 |
Across fourteen regime blocks it switched to S1 exactly once, in 2022. Before that there was only one hiking sample — 2015 — and S2 happened to win it.
So the entire excess return of the honest version rests on one decision. That is n = 1.
Check three: train/test split
We split it again: choose the rule using 2010–2018 only, then apply it unchanged to 2019–2026.
The training window picked D5 for hiking, not S1. Running that forward:
| Test window (2019–2026) | CAGR | Max drawdown |
|---|---|---|
| Regime switch (trained on 2010–2018) | 109.3% | −24.9% |
| Just holding S2 | 114.7% | −26.3% |
Out of sample, doing nothing was better.
Check four: compare against randomness
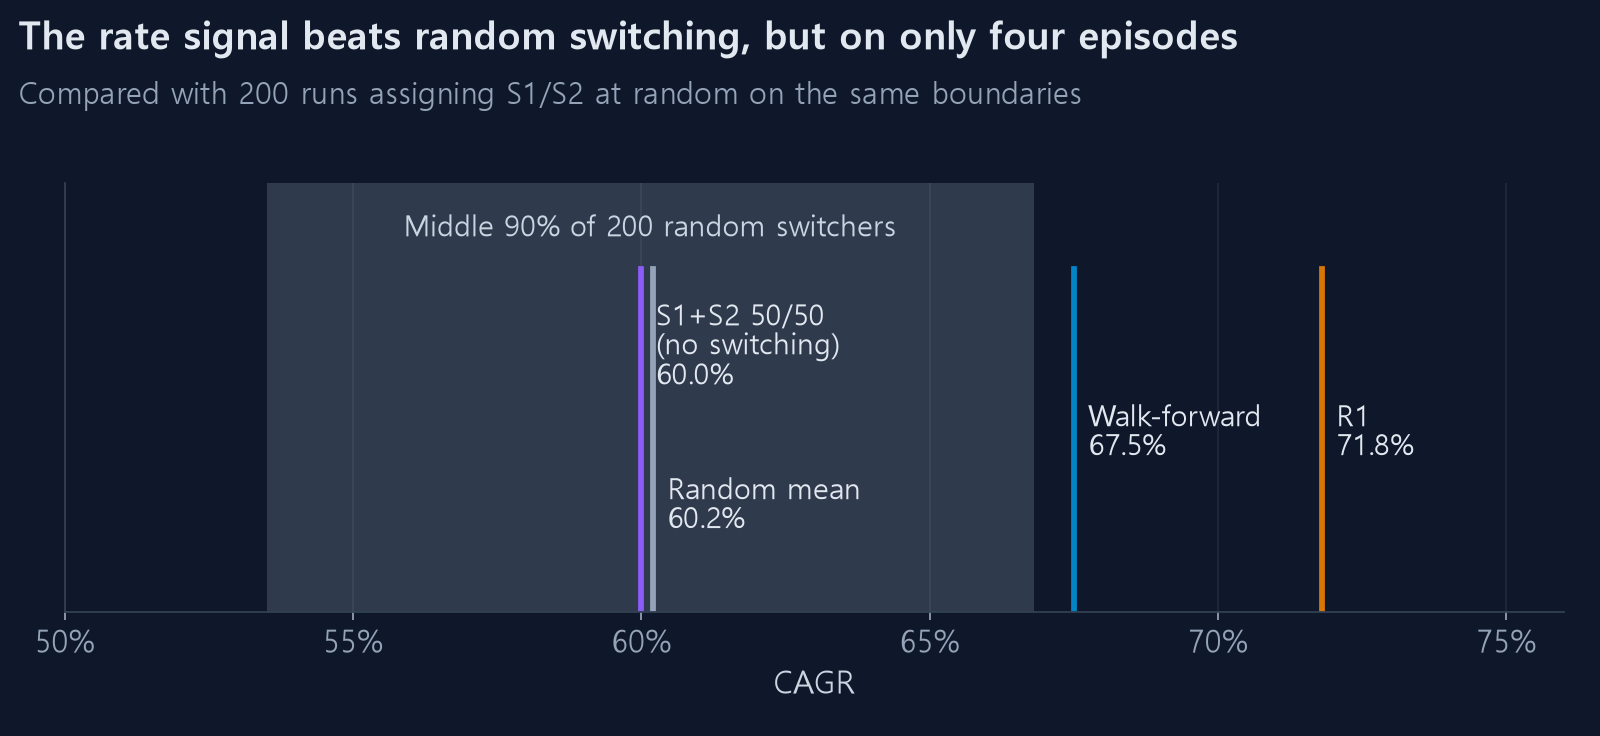
Finally, separate the value of switching at all from the value of the rate signal. We assigned strategies randomly across the same regime boundaries, 200 times.
- Random: mean CAGR 60.2%, 5th–95th percentile 53.5%–66.8%
- No switching, 50/50 capital split between S1 and S2: 60.0%
- R1: 71.8% (better than every random run)
- Walk-forward: 67.5% (better than 96.5% of them)
The rate signal does beat randomness. But that edge comes from four observations, which is not enough to call it a statistical result.
What we did about it
We deleted R1 and R2 from the site. Keeping them with an "experimental" label was tempting, but the conclusion was clear enough. If the good numbers only appear inside the window the rule was chosen on, and the whole edge rests on four hiking episodes, there is no basis for claiming the strategy will keep working. A strategy whose future is likely to look nothing like its past is not worth keeping.
The strategy list is now split-buying (A), dual-mode (D), the SOXL ladder (S) and the FAS-only family (F). Nothing switches on the rate regime any more.
We keep the validation write-up because knowing which check caught what outlasts the strategy itself.
Four checks you can run yourself
When a backtest looks good, work through these in order.
- When did you decide the rule? If you chose it after seeing the result, that result is not evidence for it.
- Shake every parameter by 20%. If the neighbours are similarly good there is real structure; if only that exact setting works, you fitted noise. (Good parameters sit on a plateau)
- Split the period. Decide on the first half, verify on the second. The 30-year report breaks results out year by year, which makes this easy to eyeball.
- Count your samples. To claim something "works during hikes", count how many hiking cycles there were. Four is an observation, not a statistic.
Finally
Producing a good backtest result is easy. Try enough parameter combinations and a meaningless rule will look excellent. The hard part is trying to break your own result, and if you skip it the market does it for you later.