Suppose you found the best setting in a backtest. Should you use it?
If only that one setting looks good, no. Here is why, with data.
Why peaks are dangerous
Run forty parameter combinations and pick the best, and that setting is most likely fitted to the accidental bumps in past data.
Toss a coin forty times each with forty people and pick whoever got the most heads. That person is not good at coin tossing; they were lucky. Parameter search works the same way. Try enough combinations and a meaningless setting will look excellent.
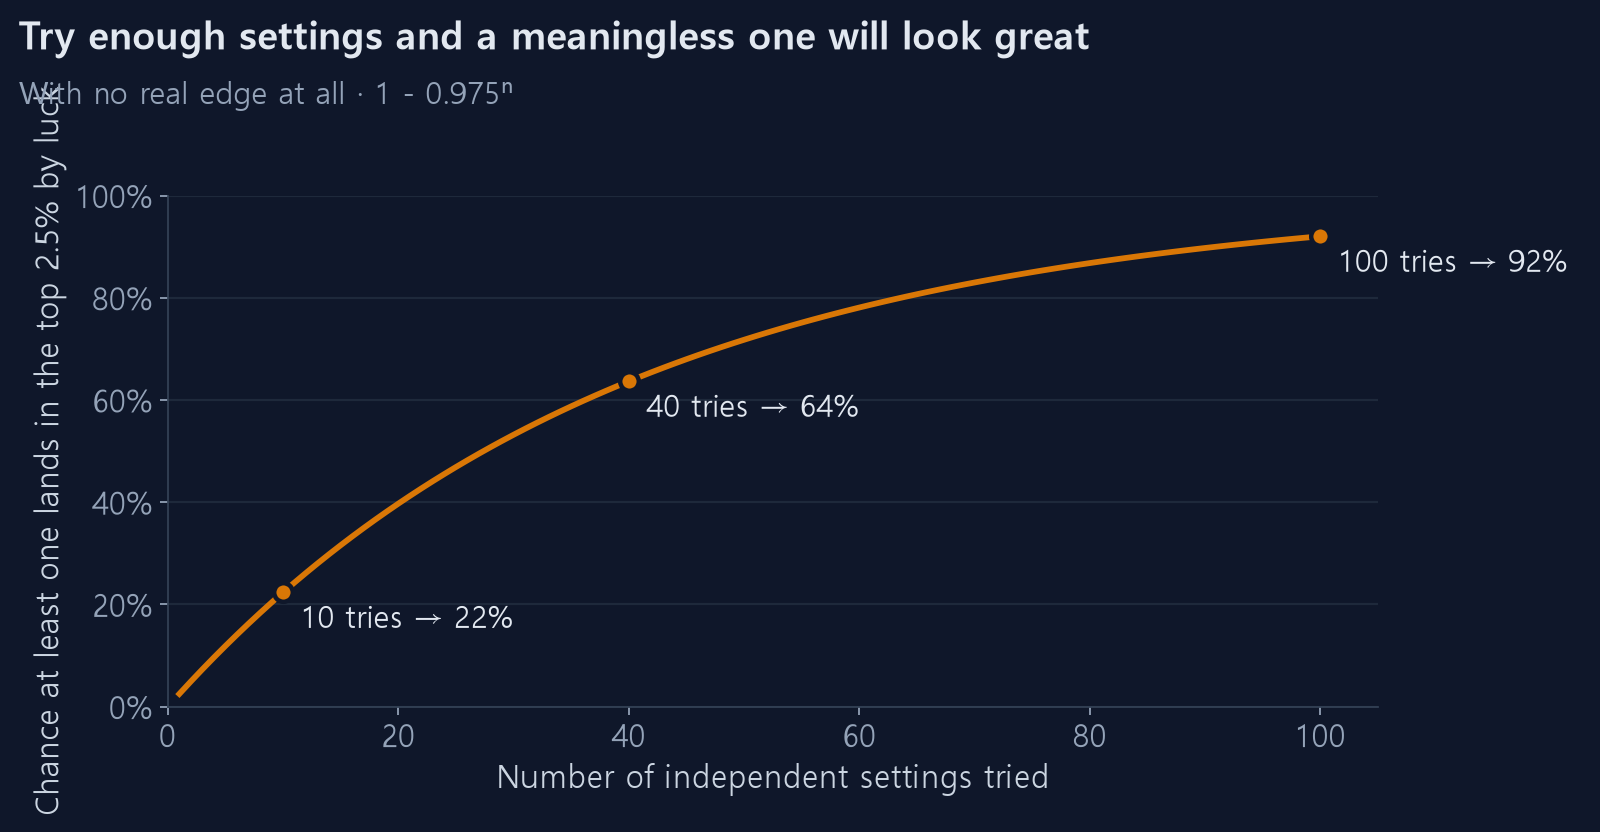
To put a number on it: even for a strategy with no real edge at all, testing forty independent settings gives you better than a 63% chance that one of them lands in the top 2.5% purely by luck. Clicking through a few values on the backtest screen gets you there quickly.
A plateau is different
If the neighbouring settings are similarly good, the picture changes. Luck rarely makes an entire neighbourhood look good at once. That is a sign of real structure.
An analogy: standing on a sharp peak, one wrong step and you fall. Standing on a broad plateau, you can walk several steps in any direction and stay at the same height. Live trading is always a step off. The future market is never exactly the past.
What we found ①: a genuine plateau
We ran forty averaging-down combinations (five drawdown triggers × four account counts × two trigger bases) and repeated the whole thing three times, changing only the added capital.
Run 1: added capital $10,000
Run 2: added capital  $5,000
Run 3: added capital  $2,500
With a fourfold difference in capital, of course the results differ. But what about the ranking?
The winner was the same all three times, and the top twelve combinations were the same set in all three runs — every one of them a −10% or −15% trigger with three to five accounts.
That is a broad plateau. The good region survived a large change in conditions, which is evidence it is not an artefact of the past data.
What we found ②: a genuine peak
Varying only the time cut on SOXL over sixteen years with A2 Standard:
| Time cut | Return |
|---|---|
| 15 | 17,172% |
| 20 | 24,127% |
| 30 | 15,386% |
| 60 | 26,340% |
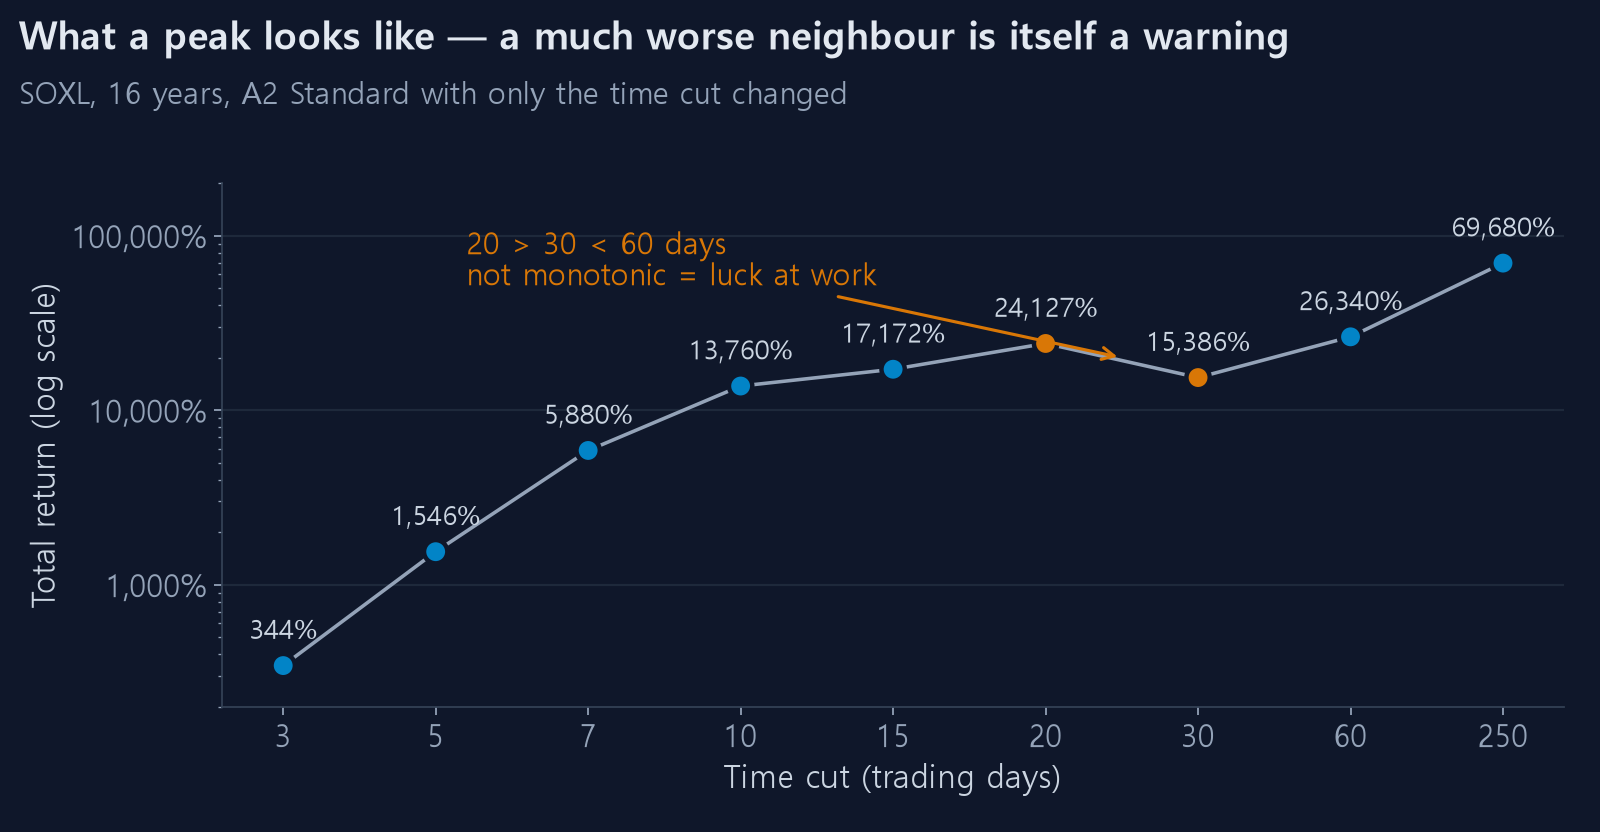
Twenty sessions returns 1.6x what thirty returns. Then sixty goes back up again.
The relationship is not monotonic. There is no structural reason for 20 to be special, so a spike there means that value happened to line up with the timing of a few past rebounds.
Do not read this table as "20 sessions is optimal". The fact that the neighbouring value of 30 is much worse is itself the warning.
What we found ③: not a plateau, a broken switch
In the same data, triggers of −25% and −30% gave identical results whether the account count was three or five, and whether the trigger basis changed or not.
That is not a plateau; it is nothing happening. The trigger was so deep it almost never fired, so every setting collapsed back to the base strategy.
"Stable results" and "the feature is not running" look alike from outside. If changing a setting leaves the result identical to the decimal place, suspect the latter.
This site shows a "blocked days" count whenever you enable a filter. If that count is zero, the filter is switched on and doing nothing.
How to check
Shake every parameter by ±20%.
- Entry trigger −1.0% → −0.8%, −1.2%
- Profit target 1.5% → 1.2%, 1.8%
- Time cut 10 → 8, 12
If the result swings hard, do not use that setting. If it halves, stop there.
One rough rule:
If ±20% moves the return by more than 30%, you are on a peak.
Not rigorous, but it filters plenty in practice.
Check the yearly breakdown too
Shaking parameters is not enough. Use the 30-year report to see results year by year. If one year produced all of the profit, that is a peak as well — the year was good, not the strategy.
An easy test: drop the single best year and recompute the average. If it falls by more than half, the strategy is essentially that one year.
Finding a plateau is not the end
Even standing on a broad plateau, the question remains when you found it. If you located the plateau after seeing all of the historical data, it is still fitted to that data.
Shaking parameters cannot catch this. What catches it is walk-forward testing. How a strategy of ours fell apart under exactly that test is written up in what to check first when a backtest looks good.
Summary
- A setting that is uniquely good is fitted to the past
- Neighbouring settings must be similarly good before you trust it
- Rankings that survive a large change in conditions are a strong signal
- A neighbouring value being much worse is itself a warning
- But if results are exactly identical, the feature may not be running at all
- Even with a plateau, verify when you found it
The full list is in the pre-live checklist and why backtests look better than reality.