A good number makes you want to start immediately. Here is what to check first, in order. Every item can be done on this site in a few clicks.
1. Have you wobbled the parameters?
Start here. Move the trigger, the profit target and the time cut by 20% each way.
- entry trigger −1.0% → −0.8%, −1.2%
- profit target 1.5% → 1.2%, 1.8%
- time cut 10 days → 8, 12
If the result swings wildly, the settings were fitted to accidental bumps in past data. A healthy strategy sits on a broad plateau. A single sharp peak surrounded by bad numbers will not repeat.
If returns halve, stop there.
2. Does the window include a bear market?
Split buying is strong when markets fall and then recover. When they slide without recovering, you just accumulate. You have to include a period that exposes that weakness.
| Period | Character |
|---|---|
| Q4 2018 | Short, sharp decline |
| Feb–Mar 2020 | Crash and immediate recovery |
| All of 2022 | Long grind down, no recovery |
| 2015–2016 | Directionless chop |
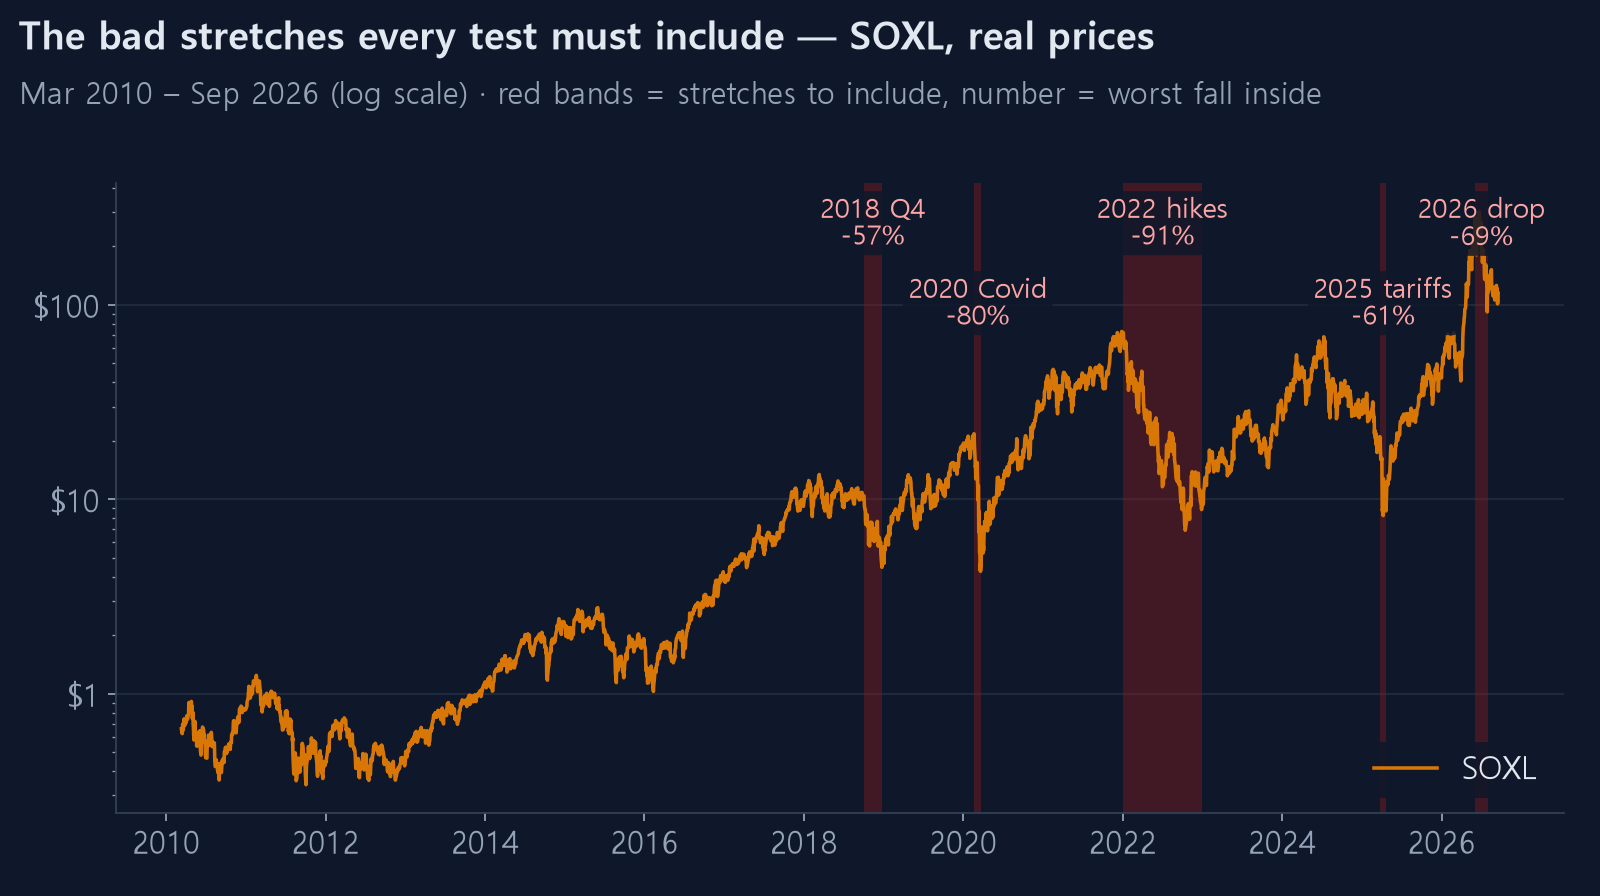
The "30-Year Report" button breaks results out by year. You want good years and bad years mixed. If one year produced all the profit, that may have been the year rather than the strategy.
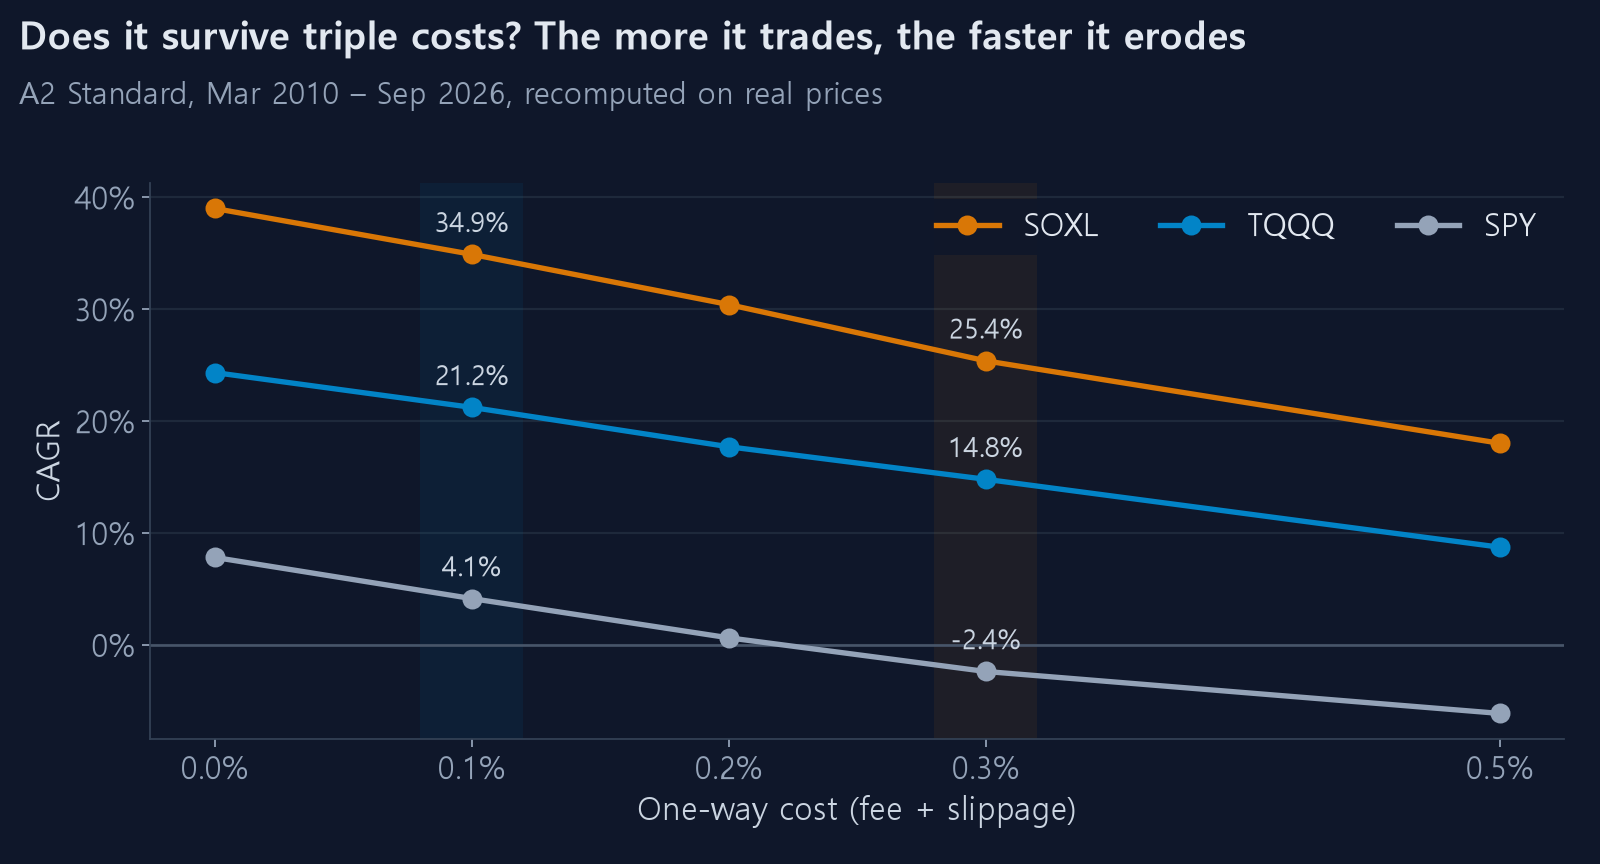
3. Does it survive costs at 3x?
Change the fee from 0.1% to 0.3% and run it again.
Real trading costs more than commission. Slippage means your fill sits slightly above the close you assumed. The more you trade, the more this compounds.
If profit vanishes here, the strategy was always being eaten by trading costs. It only looked alive because the backtest was generous about them.
Check the trade count and average holding days too. An average hold of three or four days with 200+ trades is inherently cost-sensitive.
4. Have you allowed for tax?
Backtest numbers are pre-tax. Capital gains on US equities are taxable, and a high-turnover strategy is hit harder after tax.
Rates, allowances and filing rules vary by country and change from year to year, so check with a tax professional or your tax authority. The only thing this page can tell you is that your after-tax return is lower than the figure on screen.
5. Have you converted the drawdown into money?
"−45%" reads calmly. Multiply it by your actual capital.
$50,000  ·  MDD −45%  →  $27,500
$200,000 ·  MDD −45%  →  $110,000
Could you watch that number shrink for months? If you hesitate, lower the leverage or the capital.
Look at the length of the drawdown as well. Find the flat valley in the equity curve and see how long it runs. People abandon strategies not at the bottom but weeks after it, when nothing has recovered. Why maximum drawdown matters more than returns covers this in detail.
6. Did the product exist back then?
Check the listing date, shown when you select a ticker.
- SOXL, TQQQ: listed 2010 → the 2008 crisis cannot be tested on real prices
- SPYU: listed December 2023 → not even 2022 exists in real prices
- GDXU: listed December 2020 → almost entirely a gold bull market
This site now fills the years before listing with index-based prices built from the 1x index, so tests can go back to the 1990s. That shows periods the real products never lived through, but those years are an estimate, not traded prices. When a result is marked "index-based", read it with that in mind. (How the index-based history is built and checked)
If it is an ETN, remember the issuer can redeem it early. A good strategy is worth nothing if the instrument disappears.
7. Have you paper traded it?
If it cleared everything above, follow it by hand for at least a month before funding it.
The "Today's Orders" page exists for this. Give it a strategy and a start date and it computes the buy limit for the next session, the sell target for each tranche you would be holding, and when each time cut lands.
Check it daily, record what you would have done, and watch for these:
- can you place an order at the close, on a normal weekday, consistently?
- when the rules say buy, do you actually do it? (that moment is usually the scariest)
- can you stomach closing a losing tranche because a timer ran out?
If you cannot follow the rules, the backtest tells you nothing. It was computed on the assumption that you followed them perfectly.
8. Have you sized down the first cheque?
Even after all of that, start with an amount you can afford to be wrong about. Try a quarter of your planned capital for a few months and record how far your real fills drift from the backtest's assumptions.
Register the same setup on the Accounts page and you can compare the simulation against your real account side by side. If the gap is wide, understand why before adding money.
Summary
- [ ] Result holds when parameters move ±20%
- [ ] 2018, 2020 and 2022 are inside the window
- [ ] Still profitable at 0.3% fees
- [ ] Still worthwhile after tax
- [ ] The drawdown in dollars is survivable
- [ ] The instrument existed for the whole period
- [ ] One month of paper trading is done
- [ ] The first cheque is a quarter of the plan
A backtest tells you how a set of rules behaved in specific past conditions. Expecting more than that is the mistake described in five reasons a backtest looks better than reality.
This page explains a method of analysis. It is not a recommendation to buy or sell anything, and the outcome of any decision is yours.