SOXL and TQQQ listed in 2010. Real prices alone therefore show sixteen years that never contain the dot-com bust (2000–2002) or the financial crisis (2008) — sixteen years in which chips and the Nasdaq mostly went up. Pick a strategy on that stretch alone and good numbers are almost guaranteed.
This site now fills the years before listing with index-based prices, so the tools can go back to the 1990s. This guide explains how the index-based series is built and how far you can trust it.
Index-based prices are not prices anyone traded at. When a result includes the index-based range, the backtest screen says so, and yearly tables mark those years "index-based".
How it is built
A leveraged ETF promises N times the daily return of its index. So if an older index or 1x ETF tracks the same market, you can take its daily return, multiply it by N and chain the days together. Then subtract what the real product costs.
index-based daily return = leverage × underlying daily return
                       − (fund fee + (leverage − 1) × 13-week T-bill rate + tracking cost) ÷ 252
- Fund fee — each product's real expense ratio (SOXL 0.75%, TQQQ 0.84%, SPYU 2.95%…)
- Borrowing cost — a 3x fund is like borrowing twice your stake, so 2 × the short rate
- Tracking cost — real funds lag the formula above a little, because of swap spreads and daily rebalancing. On the years where real and index-based prices overlap we solved for the annual cost that makes the index-based CAGR equal the real one, capped at 0–6% so that short or mismatched overlaps are not over-corrected
Leveraged funds carry their distributions inside the price, so wherever possible the input is a 1x ETF with dividends reinvested. For older stretches with only a price index, an estimate of the index's dividend yield is added back (0.2%/yr for SOXL's ^SOX stretch, in line with the 0.03–0.3% measured for large chip stocks at the time).
Take SOXL: the PHLX Semiconductor Index (^SOX) from 1994 to June 2001, then the 1x semiconductor ETF SOXX from July 2001. Note that until October 2010 SOXX was called IGW and tracked the S&P GSTI Semiconductor Index — a similar chip index, not the ^SOX that SOXL followed (daily correlation about 0.97).
Sources per ticker
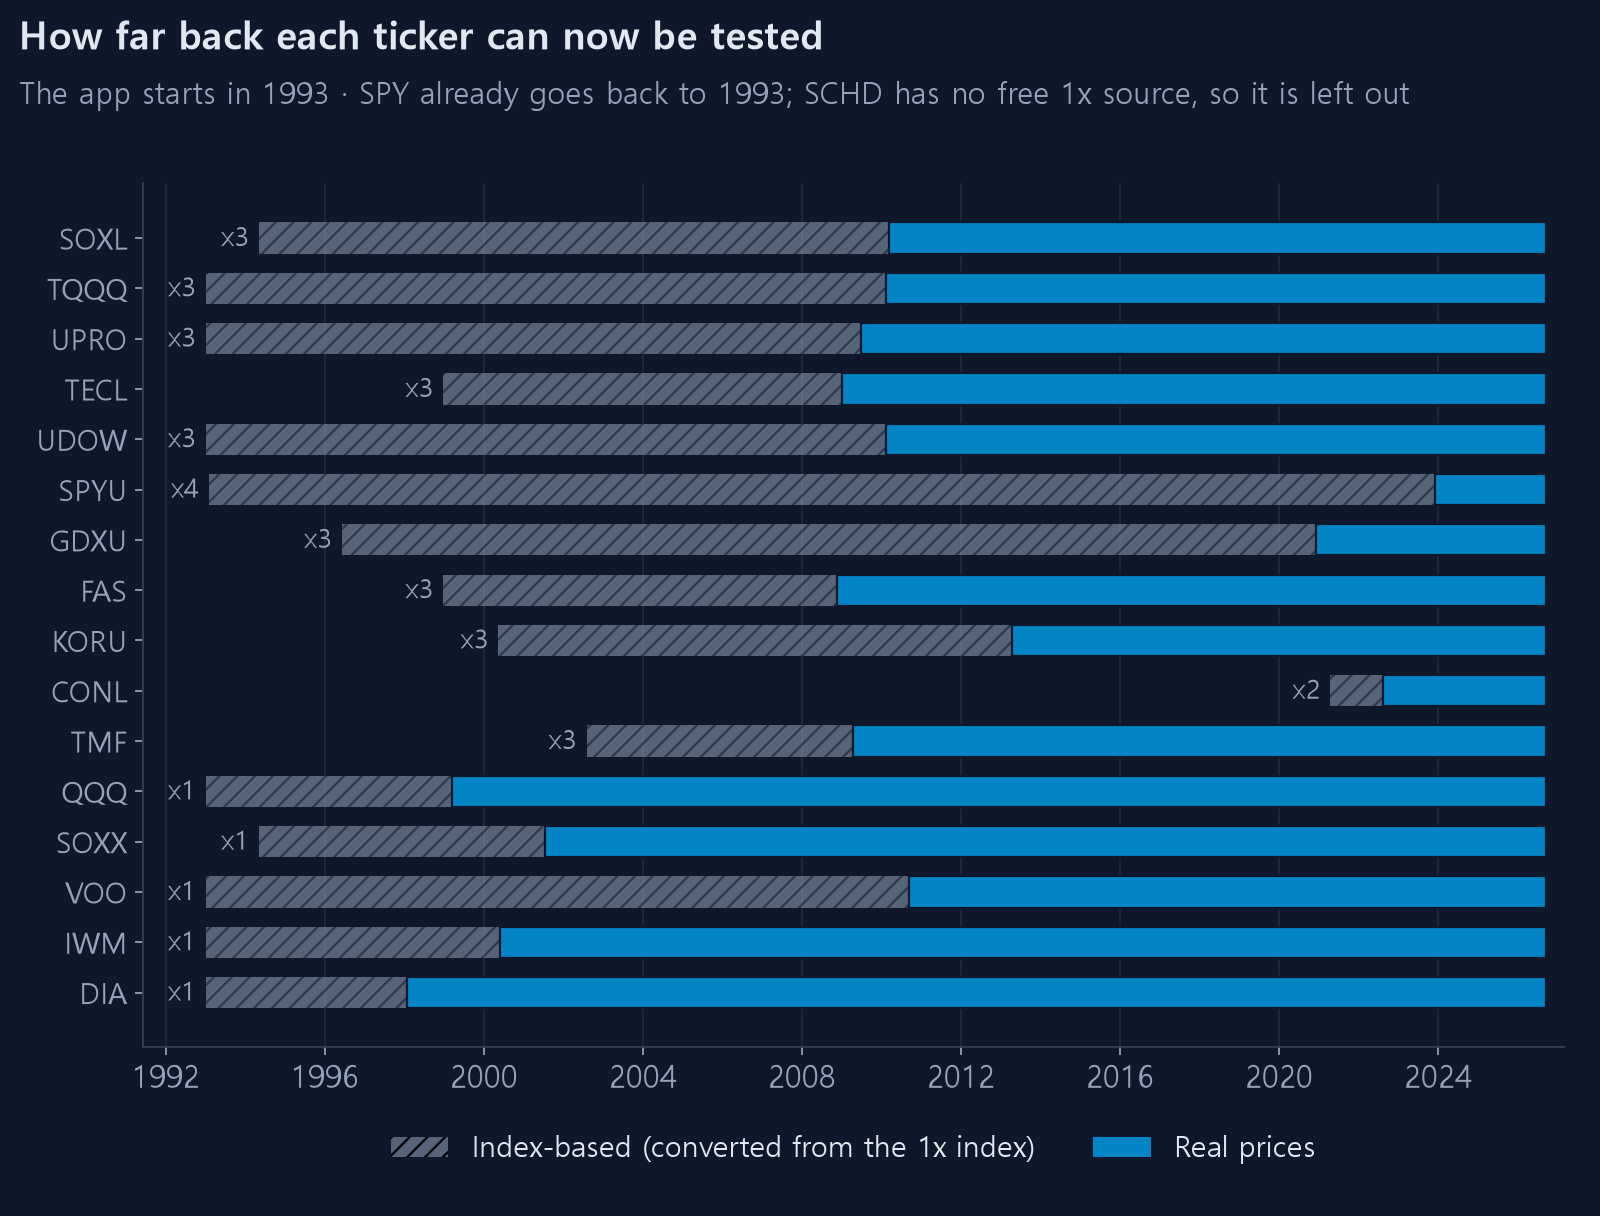
| Ticker | Leverage | 1x source | Index-based range | Tracking cost |
|---|---|---|---|---|
| SOXL | 3 | PHLX Semiconductor Index → SOXX (IGW, S&P GSTI Semiconductor Index, until Oct 2010) | May 1994 – Mar 2010 | 2.3%/yr |
| TQQQ | 3 | Nasdaq-100 Index → QQQ | 1993 – Feb 2010 | 1.5%/yr |
| UPRO | 3 | S&P 500 Index → SPY | 1993 – Jun 2009 | 1.6%/yr |
| TECL | 3 | Technology Select Sector ETF XLK | Dec 1998 – Dec 2008 | 3.2%/yr |
| UDOW | 3 | Dow Jones Industrial Average → DIA | 1993 – Feb 2010 | 1.4%/yr |
| FAS | 3 | Financial Select Sector ETF XLF | Dec 1998 – Nov 2008 | 0% |
| KORU | 3 | iShares MSCI South Korea EWY | May 2000 – Apr 2013 | 3.3%/yr |
| TMF | 3 | iShares 20+ Year Treasury TLT | Jul 2002 – Apr 2009 | 3.4%/yr |
| GDXU | 3 | Gold BUGS Index → GDX | Jun 1996 – Dec 2020 | 6.0%/yr (cap) |
| SPYU | 4 | SPY, dividends reinvested | 1993 – Dec 2023 | 6.0%/yr (cap) |
| CONL | 2 | Coinbase stock COIN | Apr 2021 – Aug 2022 | 0% |
| QQQ, SOXX, VOO, IWM, DIA | 1 | their index | before listing | — |
SPY already has real data from 1993. SCHD has no free 1x source for its index, so it has no index-based range.
How closely does it match the real ETFs?
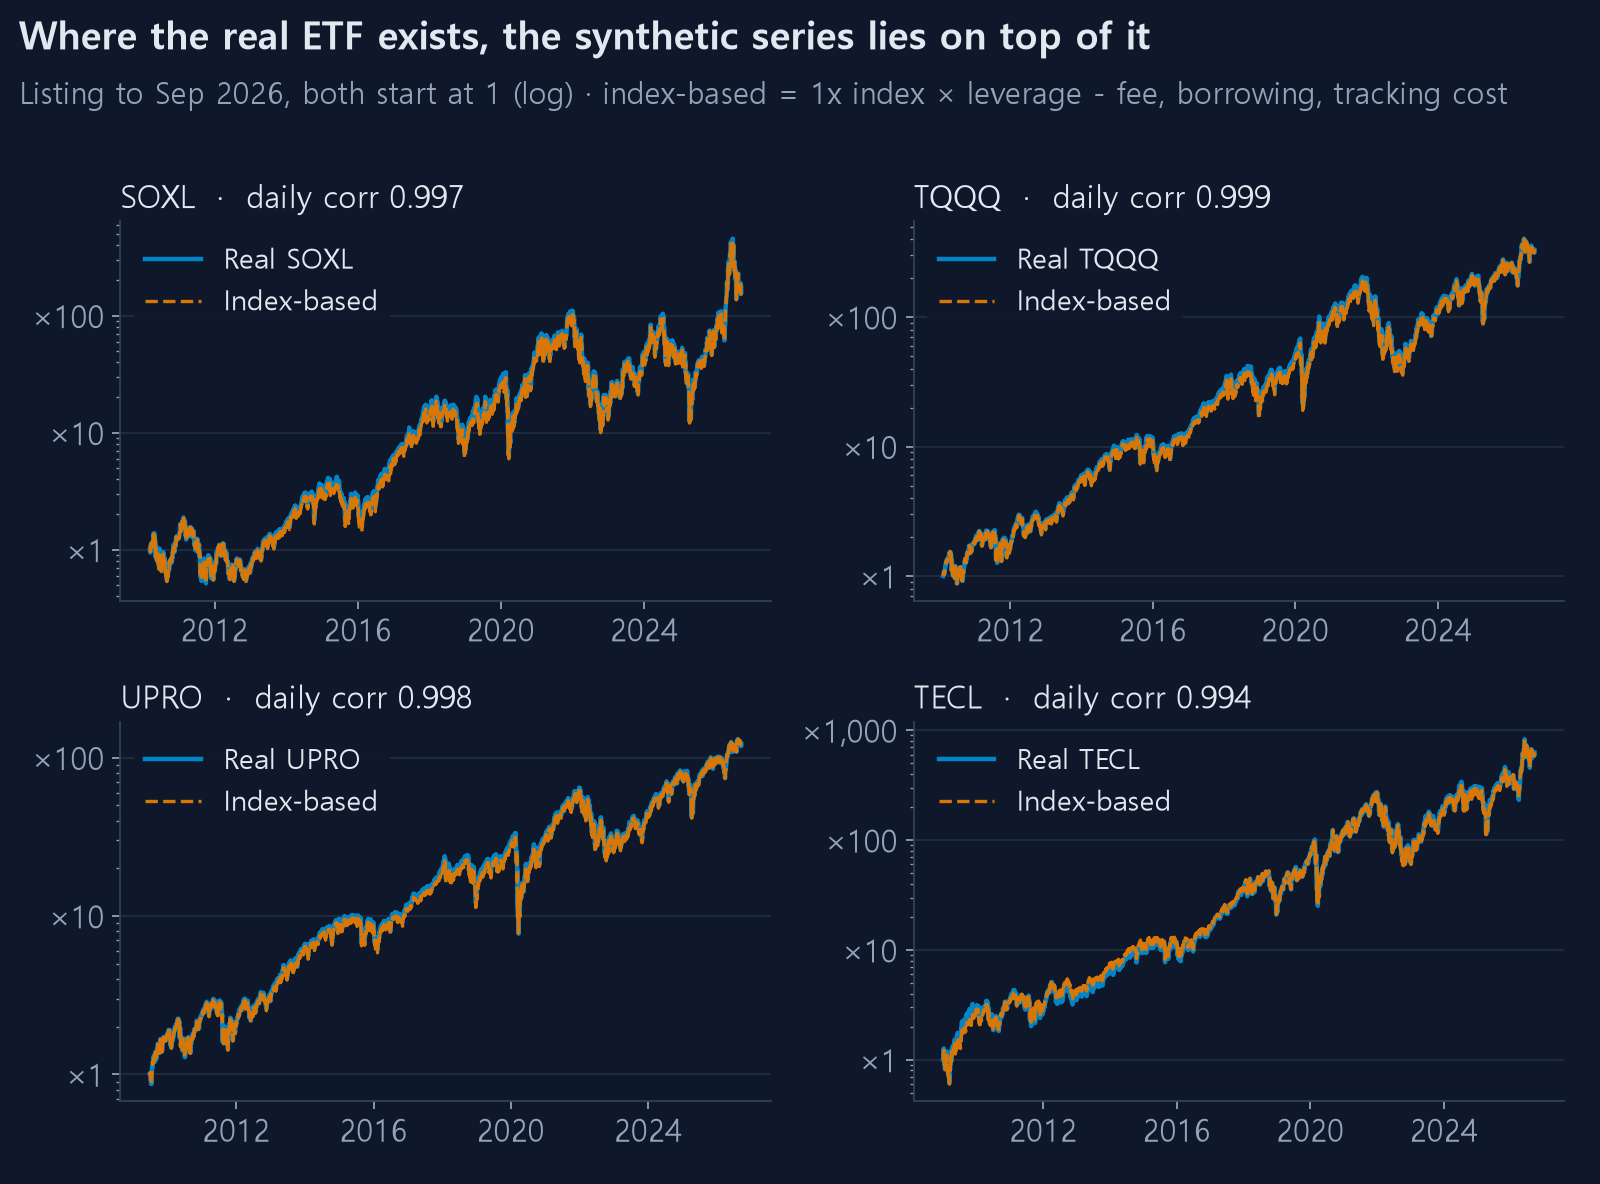
After listing we have real prices, so we built the index-based series past the listing date with the same method and laid it over the real ETF.
| Ticker | Overlap | Daily return correlation | Real CAGR | Index-based CAGR |
|---|---|---|---|---|
| SOXL | 16.5 yrs | 0.997 | 37.3% | 37.3% |
| TQQQ | 16.6 yrs | 0.999 | 42.0% | 42.0% |
| UPRO | 17.2 yrs | 0.998 | 32.2% | 32.2% |
| TECL | 17.7 yrs | 0.994 | 44.0% | 44.0% |
| UDOW | 16.6 yrs | 0.998 | 24.9% | 24.9% |
| FAS | 17.8 yrs | 0.988 | 14.4% | 11.3% |
| KORU | 13.4 yrs | 0.980 | −0.5% | −0.5% |
| TMF | 17.4 yrs | 0.995 | −8.7% | −8.7% |
| GDXU | 5.8 yrs | 0.995 | −8.9% | +0.2% |
| SPYU | 2.8 yrs | 0.983 | 51.3% | 53.3% |
Matching CAGRs are not an achievement — the tracking cost was solved to make them match. The number to look at is the daily correlation, mostly above 0.99: day-to-day moves are reproduced almost exactly.
Three tickers need care.
- GDXU — the real product blends in GDXJ, which is more volatile than GDX, so even with the 6% cap the index-based series beat the real one by 9 points a year. Treat GDXU's index-based years as optimistic.
- SPYU — only 2.8 years of overlap, so the correction itself is shaky. Also possibly optimistic.
- FAS — XLF differs from FAS's actual index, and the index-based series runs 3 points a year pessimistic.
The on-screen notice for these three carries the same warning.
Checking SOXL's pre-listing years (2026-10-19). Correlation over the overlap cannot confirm the years before listing, so we checked them separately.
- Closing prices hold up. ^SOX for 1994–2001 has no gaps or errors, and its dot-com peak and trough match outside sources. For 2001–2010 the daily correlation with the chip products that actually traded then (the 2x ETF USD and a 1.5x fund) was 0.97, and the 2008 drawdown at 3x came out at −94.5% index-based versus −93.5% to −94.2% backed out of the real products.
- Opening and intraday prices do not. The ^SOX stretch has almost no real opening prices (in 1997–2001 the open equals the previous close on 85–93% of days), and early SOXX traded thinly, so its opens are noisy. Treat open-based B strategies over this stretch as reference only.
- The assumptions may lean optimistic. The dividend estimate, the period the tracking cost was fitted on, and the borrowing rate (the 13-week T-bill, below real swap costs) all err on the favourable side, so the pre-listing years may come out 1–2 points a year too good. Even so, buy and hold going to practically zero over 1994–2010 holds under any of those assumptions.
What the index-based years show
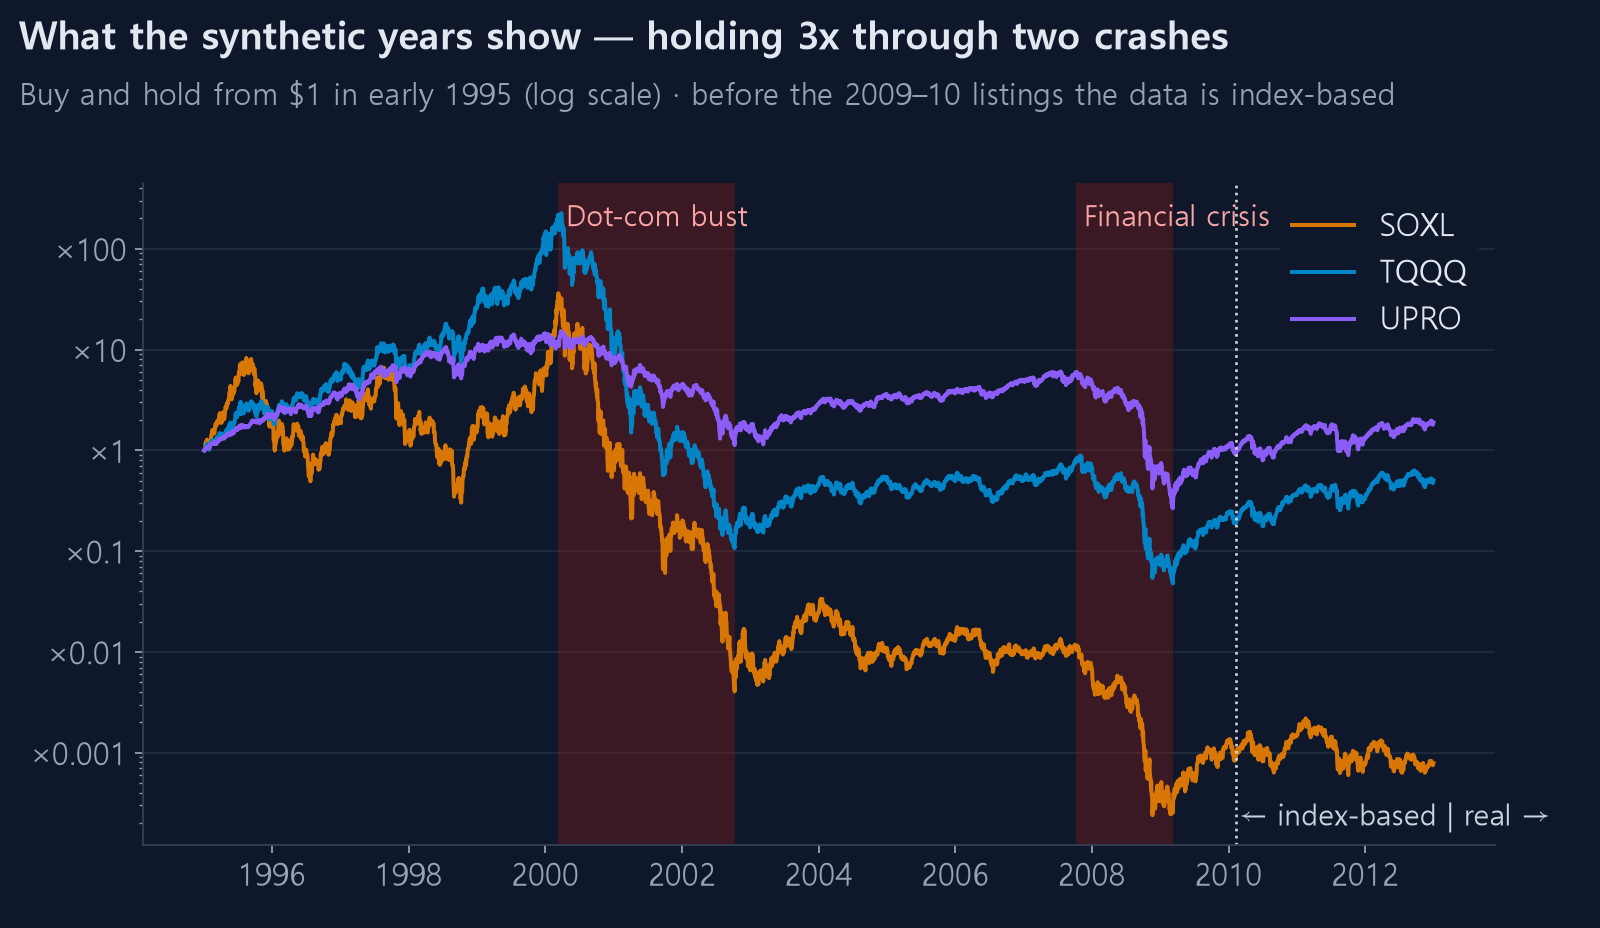
We can now look at stretches no real product has lived through. One dollar put in at the start of 1995 and simply held:
| Worst fall in the dot-com bust | Worst fall in the financial crisis | |
|---|---|---|
| SOXL (index-based) | −99.99% | −98.2% |
| TQQQ (index-based) | −99.95% | −94.6% |
| UPRO (index-based) | −92.6% | −95.6% |
3x chips and 3x Nasdaq go to practically zero in the dot-com bust. This picture is why "just hold the 3x and wait" should not be concluded from the sixteen years after 2010.
We re-ran a split-buying strategy too
The site's current A2 Standard strategy (six tranches, 1.5% target, 10-day time cut, plus a defense signal that shortens the time cut on new tranches to 5 days when SOXX is below its 200-day line with high volatility), restarted from $10,000 every January, averaged separately over index-based and real years (recalculated 2026-10-19 on the new index-based data):
| SOXL · A2 Standard | Years | Avg return | Avg MDD | Losing years |
|---|---|---|---|---|
| Index-based years (1997–2009) | 13 | +30.3% | −30.4% | 2 |
| Real years (2011–2026) | 16 | +31.9% | −21.7% | 1 |
| (ref.) Buy and hold, index-based years | 13 | +26.0% | −73.1% | 8 |
| TQQQ · A2 Standard | Years | Avg return | Avg MDD | Losing years |
|---|---|---|---|---|
| Index-based years (1997–2009) | 13 | +18.3% | −26.3% | 4 |
| Real years (2011–2026) | 16 | +21.5% | −16.5% | 1 |
On yearly averages, SOXL A2 did about as well in the index-based years as in the real ones. But those averages restart from fresh capital every January. Run continuously through 1997–2009, it compounded at 25.8% a year with a maximum drawdown of −53%, far deeper than the −36% of running the real years (2010–2026) continuously. A2's defense signal was also chosen while looking at these index-based years, so this is not a clean out-of-sample test, and its 2001–2002 results swing heavily with which 1x chip series is used for that stretch. It still held up far better than buy and hold (average drawdown −73%, eight losing years in thirteen), which says something about what the strategy is.
(Corrected 2026-10-19: this table previously showed +14.8% and four losing years, computed with A2 before its defense signal and with the old index-based data.)
That is the point of building this data: it gives a strategy a second exam outside the period it was chosen on. For a strategy picked on post-2010 data, the 1990s and 2000s are questions it has never seen. If it collapses there, it may simply be fitted to the good years. See walk-forward validation and if SOXL had existed in 1996 for more.
Limits of the index-based data
There are reasons it could look better than reality and reasons it could look worse. Do not trust it to the decimal.
- These products did not exist. Had a 3x chip ETF existed in 1999, nobody knows whether the issuer would have kept running it all the way to −99% or closed it
- Intraday highs and lows are approximations — the index's intraday range scaled by the leverage. Real intraday crashes may have been deeper
- Volume is the source's volume. Indicators that use volume can differ from reality
- Some signals (VIX3M and others) have no data before 2006. Earlier strategies that used them ran without those signals early in the index-based range. None of the current strategies on the site use VIX-based signals
- Cost assumptions may not match the past. Short rates were higher in the early 2000s, so the borrowing cost is correspondingly larger
How it shows up on the site
- Ticker description — pick SOXL and a blue note says it listed on 2010-03-11 and that earlier prices are index-based, built from the 1x index
- Results — if the start date is before listing, the same note sits above the result
- 30-year report and 30-year comparison — years before listing are marked "index-based", the listing year "part index-based"
- Ticker pages (for example SOXL ten-year results) use real prices only, so index-based numbers are never summarised in search results
To leave the index-based range out, just start the test after the listing date.