Note — strategy names such as S1–S4 and R1 in this article are from the time of the research and are no longer in the site's strategy list (A, D, B, G and I families). See the strategy guide for the current ones.
At the time of the research, S2 and S3 were not single strategies. They ran several accounts of different character at once and reported the sum — three for S2, four for S3.
Here is why, and whether it actually worked, using the results from that research.
What S2 is made of
| Sleeve | Weight | Character |
|---|---|---|
| A stable | 30% | Weekly-RSI mode switching, one runner tranche |
| B trend | 40% | Runners held to three tranches, 35-session hold limit |
| C mean reversion | 30% | Sizes buys by five-day dip depth and the VIX level |
A and B follow trends; C buys weakness. The opposing character is deliberate.
Running each on its own
SOXL 2010-03 to 2026-09, assuming the full $10,000 in each sleeve.
| CAGR | Max drawdown | Annual volatility | |
|---|---|---|---|
| A alone | 54.3% | −26.8% | 31.1% |
| B alone | 72.6% | −57.3% | 42.1% |
| C alone | 51.4% | −37.8% | 36.8% |
| S2 (A30/B40/C30 combined) | 65.1% | −42.9% | 34.8% |
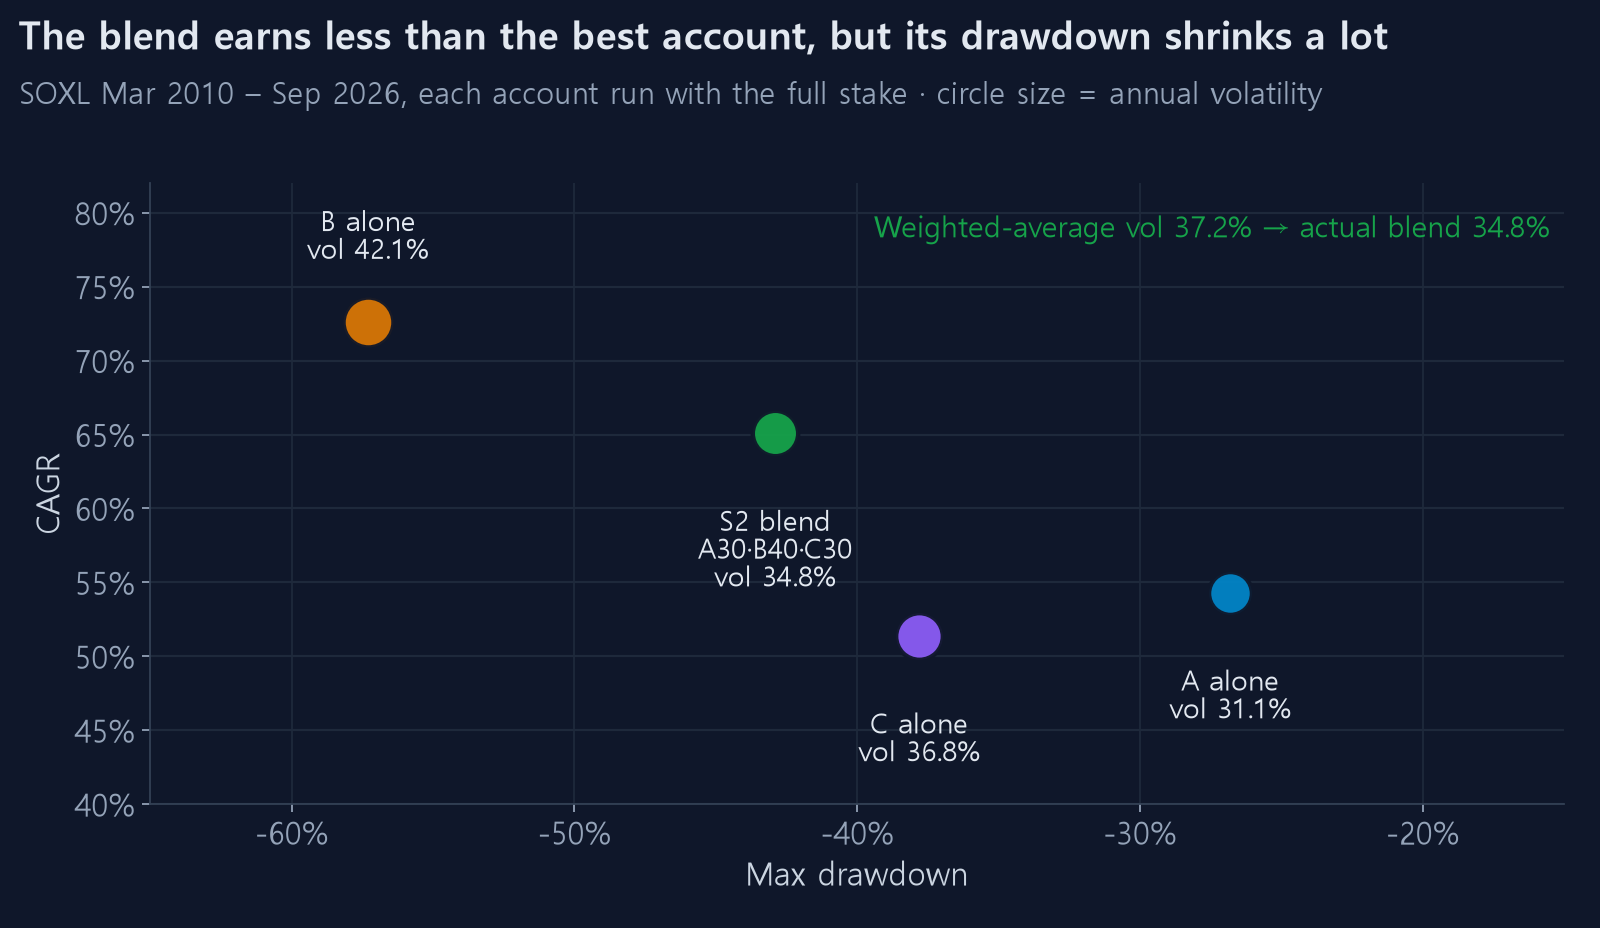
Look at the volatility column.
Weighting the three volatilities by capital gives
31.1×0.3 + 42.1×0.4 + 36.8×0.3 = 37.2%.
The actual combined volatility is 34.8%. 2.4 percentage points vanished.
That is diversification.
Where it goes — the correlation matrix
Monthly return correlations between the three sleeves:
| A | B | C | |
|---|---|---|---|
| A | 1.00 | 0.75 | 0.28 |
| B | 0.75 | 1.00 | 0.29 |
| C | 0.28 | 0.29 | 1.00 |
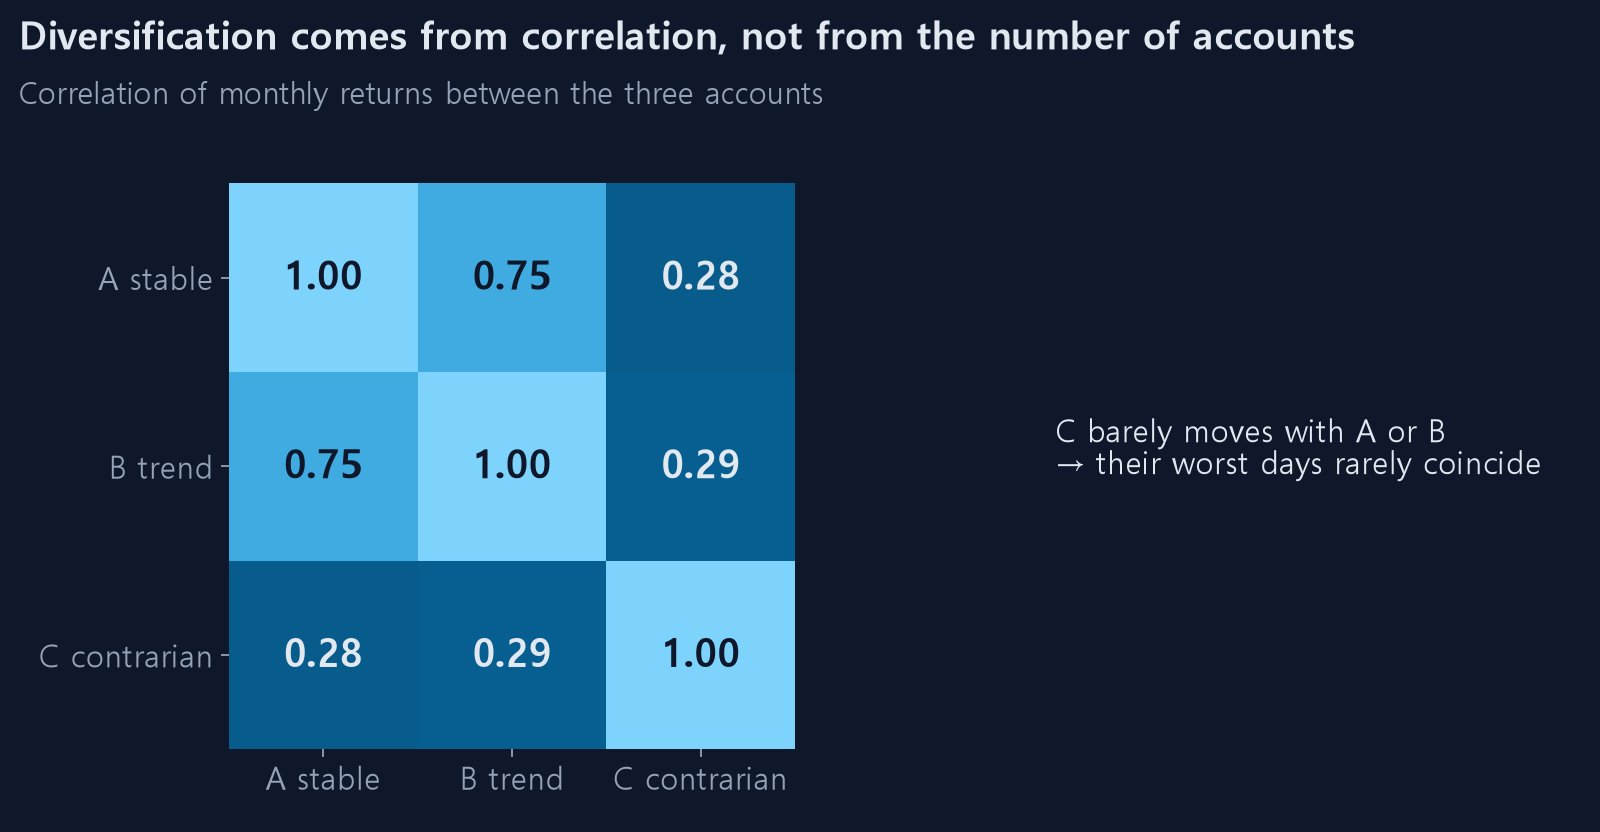
A and B correlate at 0.75, as you would expect from two trend followers. C is essentially unrelated to both at 0.28–0.29.
At a correlation of 1 there is no benefit to mixing — everything rises and falls together. The lower the correlation, the more days one sleeve holds up while another falls.
Formally, mixing two assets at weights w and (1−w):
σ² = w²σ₁² + (1−w)²σ₂² + 2w(1−w)ρσ₁σ₂
The last term shrinks as ρ falls. At ρ = 1 you get the plain weighted average; near ρ = 0 the total drops noticeably.
Why drawdown falls further than volatility
Volatility fell by 2.4pp, but drawdown fell much more dramatically: B alone is −57.3% while the combination is −42.9%.
Because maximum drawdown is a single-moment event. For the combination to reach −57%, A and C would have to be at their worst on exactly the same day as B. With low correlation that rarely happens. Worst days landing at different times is the whole mechanism.
It is not a free lunch
Look again: S2's CAGR of 65.1% is below B alone at 72.6%.
Naturally. Putting everything in the best-performing sleeve would have earned more. An ensemble trades return for stability.
By efficiency (CAGR ÷ |drawdown|):
| Efficiency | |
|---|---|
| A alone | 2.03 |
| B alone | 1.27 |
| C alone | 1.36 |
| S2 combined | 1.52 |
Better than B and C, but worse than A alone (2.03).
That matters. An ensemble is not automatically the right answer. If drawdown is your first priority, running A by itself was better — in the research, A alone was called S1.
The yearly view makes it clearer
SOXL reset each year, seventeen years:
| Avg return | Avg MDD | Losing years | Worst year | |
|---|---|---|---|---|
| S1 (A alone) | 52.1% | −13.0% | 0 | +3.1% |
| S2 (3-sleeve) | 70.0% | −14.4% | 1 | −14.0% |
| S3 (4-sleeve) | 65.1% | −13.0% | 1 | −2.0% |
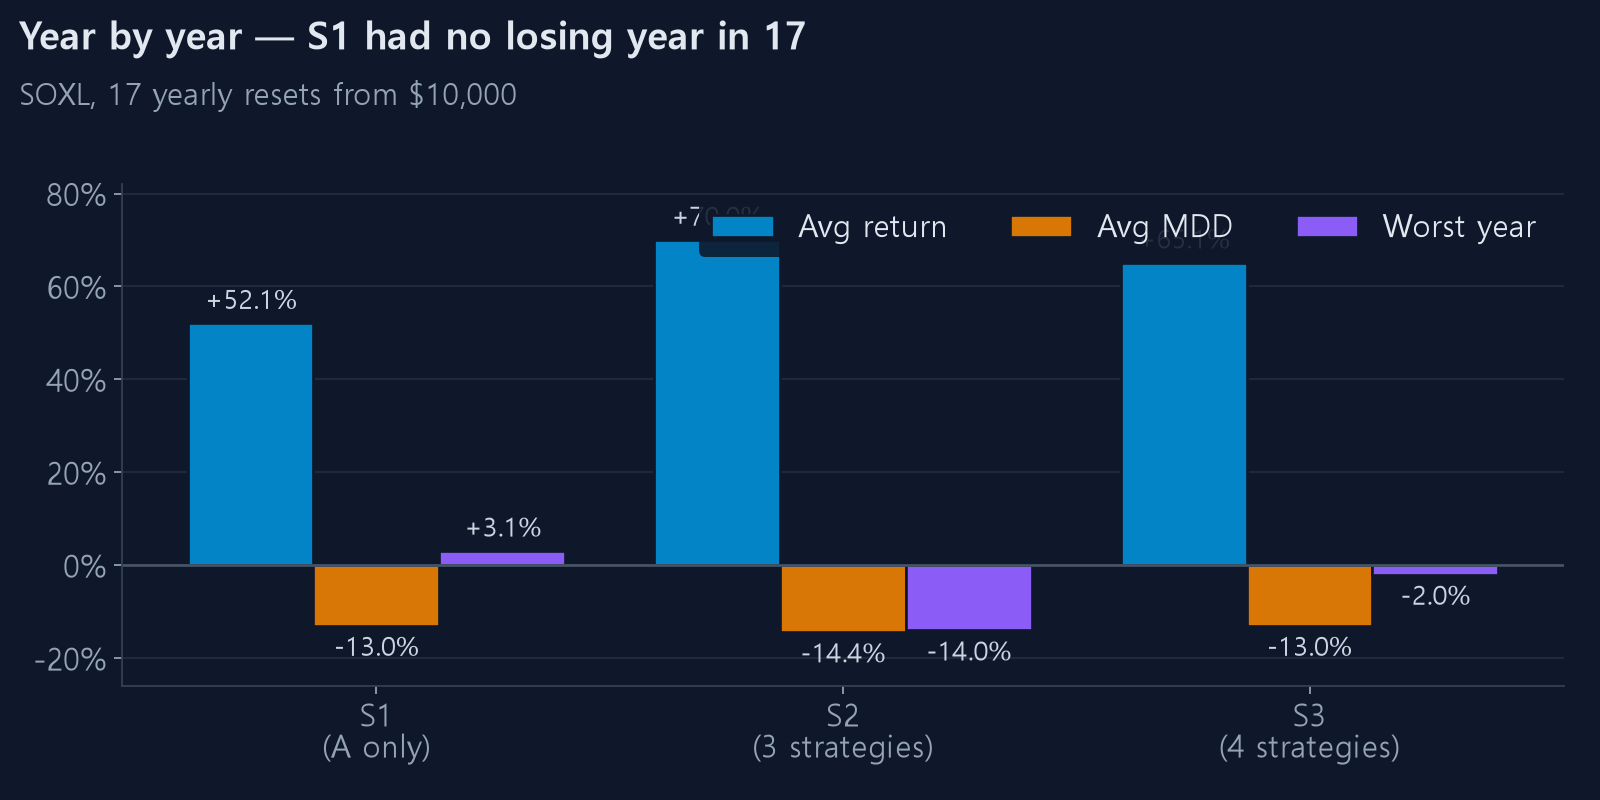
S2 leads on return but has a losing year; S1 returns less and has never had one in seventeen years.
Check it yourself
S1–S3 are no longer on the site, so the tables above cannot be reproduced directly. You can test the same idea with the current strategies instead: on the companion backtest page, split money across several current strategies (A, D, B, G and I families) and it shows the combined result.
When the weights were varied during the research:
- Raising B lifted both return and drawdown
- Raising C lowered drawdown and return together
- Zeroing any sleeve removed the diversification and hurt efficiency
Summary
- The benefit comes from the correlation. Mixing similar strategies achieves nothing; combining only A and B at 0.75 would have done very little
- Drawdown falls further than volatility, because worst days stop coinciding
- You give up return relative to the best single sleeve
- If drawdown is the priority, one stable strategy may beat the ensemble
Which to prioritise is the same question as in what tranche weights actually change: decide the drawdown you can live with, then pick what fits.
Building your own ensemble
On the companion backtest page, pick current strategies of different character and split your money between them. The A (split-buy), D (dual mode), B (volatility breakout), G (GDXU only) and I (infinite buying) families all use different buy and sell rules. Picking only within one family keeps the correlation high and leaves little to diversify.