"Rising rates hurt growth stocks," and especially "capital-hungry semiconductors get hit first," is repeated often enough to pass for common knowledge. This site holds prices back to 1993 and the full Fed policy rate history, so we checked.
Semiconductors turned out to be among the least rate-sensitive assets we measured. What actually moved with rates was small caps, dividend stocks and long bonds.
How the regimes were defined
The Fed moves every few months. Classifying by daily rate changes would label 99% of history "unchanged", which matches nobody's intuition. A six-month view lines up with how people actually experience a rate cycle.
- Hiking — today's policy rate is above where it was 126 sessions (about six months) ago
- Cutting — below
- Holding — the same
Everything uses past values only. At any point in history you could genuinely have known which regime you were in.
The rate series is the single federal funds target before December 2008 and the upper bound of the target range afterwards — the number the news means by "rates are at 3.75%".
Results by asset
Annualised returns computed from daily returns within each regime, buy and hold, over each ticker's full listed history.
| Ticker | Since | Hiking | Holding | Cutting | Hike − Hold |
|---|---|---|---|---|---|
| SOXX semiconductors | 2001 | 11.9% | 12.3% | 15.1% | −0.4pp |
| SPY S&P 500 | 1993 | 9.4% | 13.2% | 1.1% | −3.8pp |
| QQQ Nasdaq 100 | 1999 | 11.4% | 15.4% | −0.5% | −4.0pp |
| DIA Dow 30 | 1998 | 6.8% | 10.8% | 0.3% | −4.0pp |
| IWM small caps | 2000 | 5.5% | 12.6% | −0.2% | −7.1pp |
| SCHD dividend | 2011 | 4.7% | 14.6% | 6.7% | −9.9pp |
| TMF 3x long bonds | 2009 | −12.4% | −7.8% | −5.7% | −4.6pp |
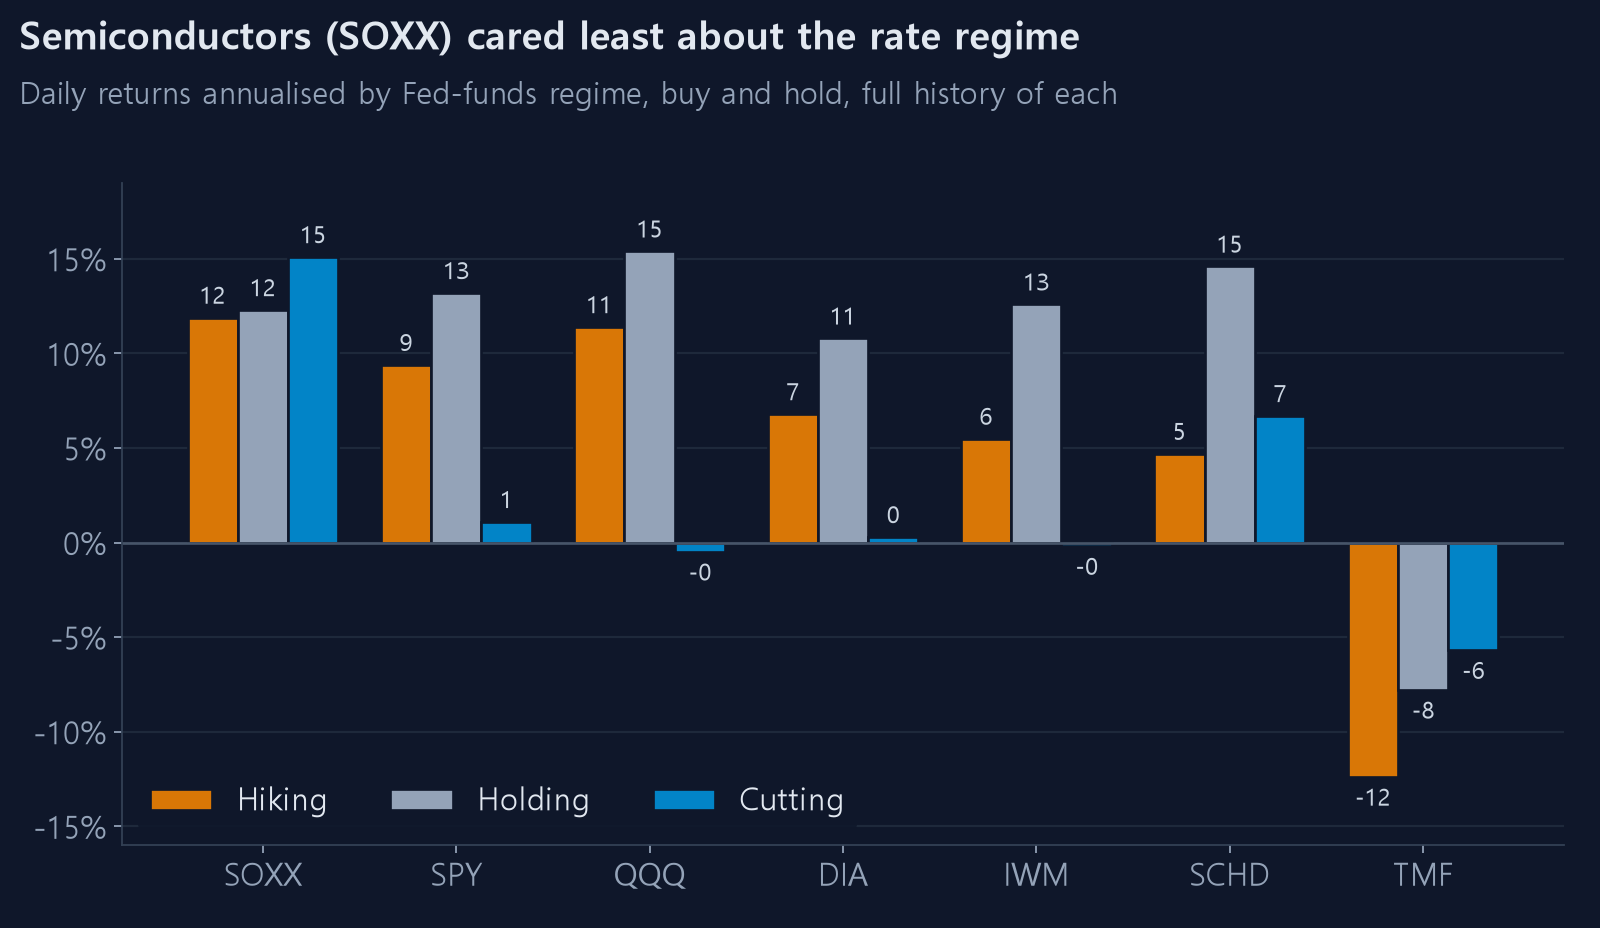
The gap between hiking and holding for semiconductors is 0.4 percentage points. That is noise. Small caps gave up 7.1pp and dividend stocks 9.9pp over the same split.
Semiconductors against large caps, head to head
SOXX versus SPY over the overlapping period since 1993:
| Regime | SOXX | SPY | Difference | Sessions |
|---|---|---|---|---|
| Hiking | 11.9% | 8.6% | +3.3pp | 1,855 |
| Holding | 12.3% | 12.1% | +0.2pp | 3,024 |
| Cutting | 15.1% | −2.6% | +17.7pp | 1,451 |
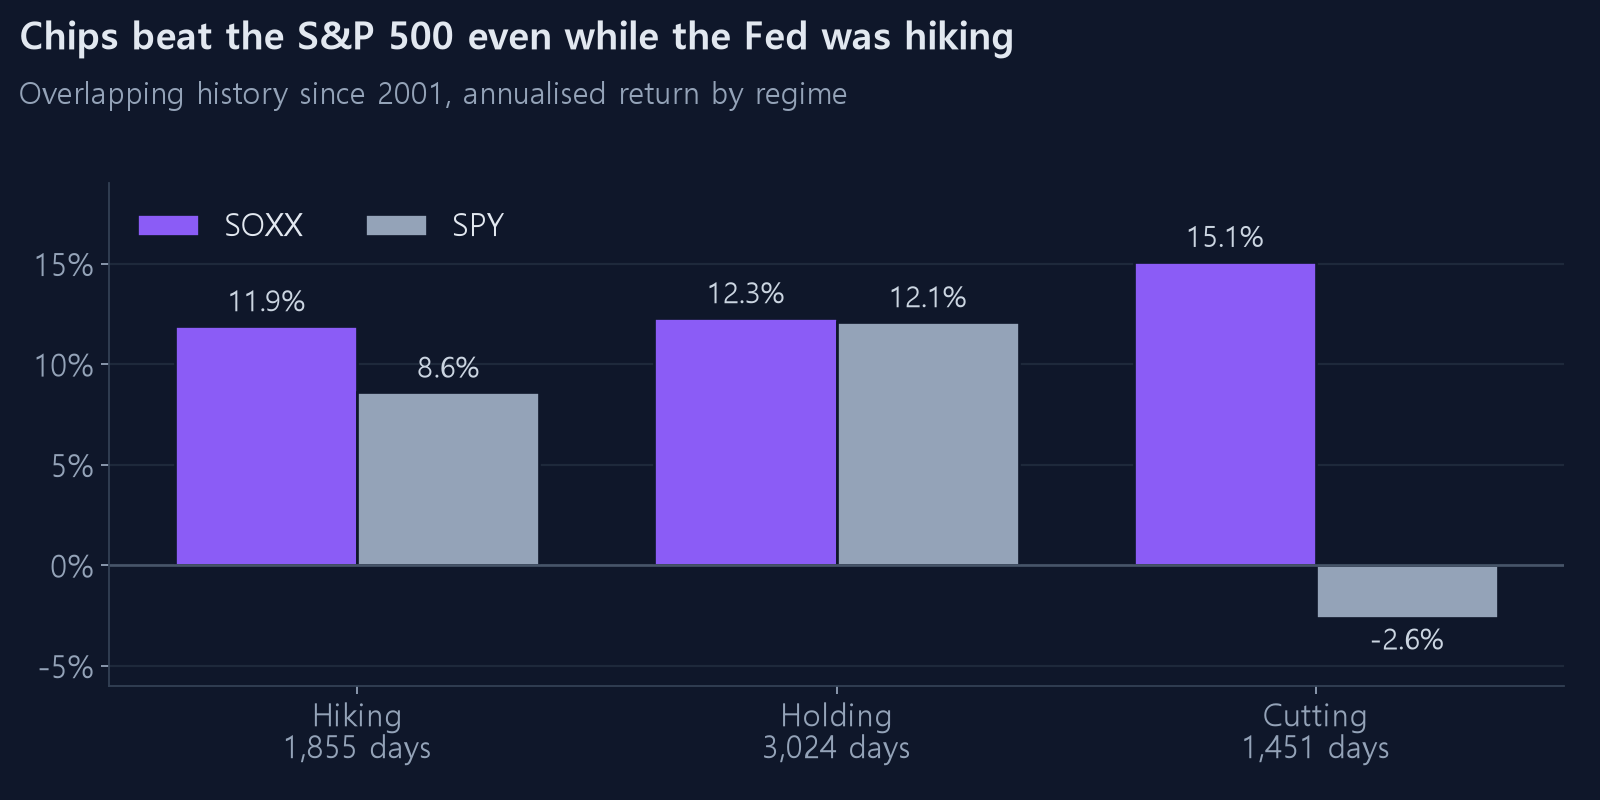
Semiconductors beat large caps during hiking cycles. That is the opposite of the story everyone tells.
Why the story is wrong
Two things stack up.
Hikes happen when the economy is strong. The Fed raises rates because the economy is running hot. Chip demand is usually hot at the same time. The discount-rate effect and the earnings effect pull against each other, and for semiconductors the earnings side won in most of these windows.
The chip cycle is much bigger than the rate cycle. What moves semiconductor prices is inventory, capex timing, and whichever demand wave is arriving — smartphones, data centres, AI. That amplitude swamps rates. The 2022 drawdown was more about post-pandemic inventory correction than about the discount rate.
What genuinely is rate-sensitive are assets whose cash flows look like a bond. Dividend stocks are valued on yield, so they lose relative appeal the moment rates rise. Long bonds are by definition on the other side of rates. Small caps carry more debt and feel funding costs directly.
The illusion that cutting cycles are good
This is the most important row in the table. The longer a ticker's history, the worse its cutting-cycle return: SPY 1.1%, QQQ −0.5%, DIA 0.3%, IWM −0.2%.
The reason is simple. The Fed cuts because something broke. Rates came down through the dot-com bust and through 2008, and prices collapsed both times.
Look only at post-2010 data and you get the opposite impression. SOXL returns an annualised 117% in cutting regimes. SOXL listed in 2010, so its only cutting episodes are 2019–2020 (the Covid rebound) and 2024–2026 (the AI rally) — both of which happened to coincide with semiconductor bull runs.
The same rule produces opposite conclusions depending on the window you fit it to. That is exactly why a statistic built on two or three observations cannot be trusted.
So can you trade it?
We tried. A rule that runs a defensive strategy while the Fed hikes and an aggressive one otherwise produced 71.8% annualised with a −23.9% drawdown on SOXL, against 65.1% and −42.9% for simply holding the aggressive one.
Then we tested it honestly, re-choosing the rule at each point using only data available at the time. The edge almost entirely disappeared. Four hiking episodes in sixteen years is not enough for the rule to learn anything in time. So we removed that strategy from the site — nothing in the current list switches on the rate regime. The full test is in what to check first when a backtest looks good.
What to take away
- "Rising rates hurt chips" is not supported by the data, at least in US markets since 2001.
- Dividend stocks, small caps and long bonds are the rate-sensitive ones. If you hold those, the regime matters far more than it does for semiconductors.
- Cutting cycles are not the good times. The last fifteen years created that illusion.
- To see it yourself, slice periods on the backtest page. The policy rate is drawn on the equity chart, so you can watch how a strategy behaved through the high-rate stretch.