You put in $10,000, then added another $10,000 six months later. At year end you have $22,000. What is your return?
There is more than one answer, and it depends on what you divide by. When judging something like averaging down, where money goes in partway, this difference flips conclusions.
Simple return — divide by everything you put in
(22,000 − 20,000) / 20,000 = +10%
The most intuitive: how much did I make relative to what I committed.
The flaw is that money added late counts as if it had been there all along. The $10,000 that worked for six months sits in the denominator exactly like the $10,000 that worked for twelve. Adding capital midway therefore looks worse than it was.
Push it to an extreme and it is obvious. Add $100m on 31 December and measure the next day: that money worked for one session but enters the denominator in full, so the return prints near zero. Not because the strategy was bad, but because of the arithmetic.
Modified Dietz — count money for the time it worked
The method used for fund performance. Each cash flow is weighted by the fraction of the period remaining after it arrived.
Average invested capital = 10,000 × 1.0 + 10,000 × 0.5 = 15,000
Return = 2,000 / 15,000 = +13.3%
The $10,000 added with half the year left counts as $5,000. The same profit divided by the money that actually worked is fairer.
The same outcome is +10% by simple return and +13.3% by Modified Dietz. A 3.3 percentage point gap created purely by the formula.
This site uses Modified Dietz as the default for averaging-down results.
Time-weighted return — remove cash flows entirely
The fund-unit-price concept. You break the period at every cash flow, compute each segment's return, and multiply them together.
Segment 1 (0–6M): 10,000 → 9,000   →  −10%
   (add 10,000 here, value becomes 19,000)
Segment 2 (6–12M): 19,000 → 22,000  →  +15.8%

Time-weighted = (1 − 0.10) × (1 + 0.158) − 1 = +4.2%
The same case is +4.2%, far from the other two.
Why so low? Because the money went in right after a fall and then caught the rebound. Time-weighted return strips out that timing benefit.
That makes it the right measure for "how good was the strategy itself", and the wrong measure for "what happened to my money".
The three side by side
| Value | Answers | |
|---|---|---|
| Simple | +10.0% | Result against everything I committed |
| Modified Dietz | +13.3% | How efficiently the capital worked |
| Time-weighted | +4.2% | How good the strategy itself was |
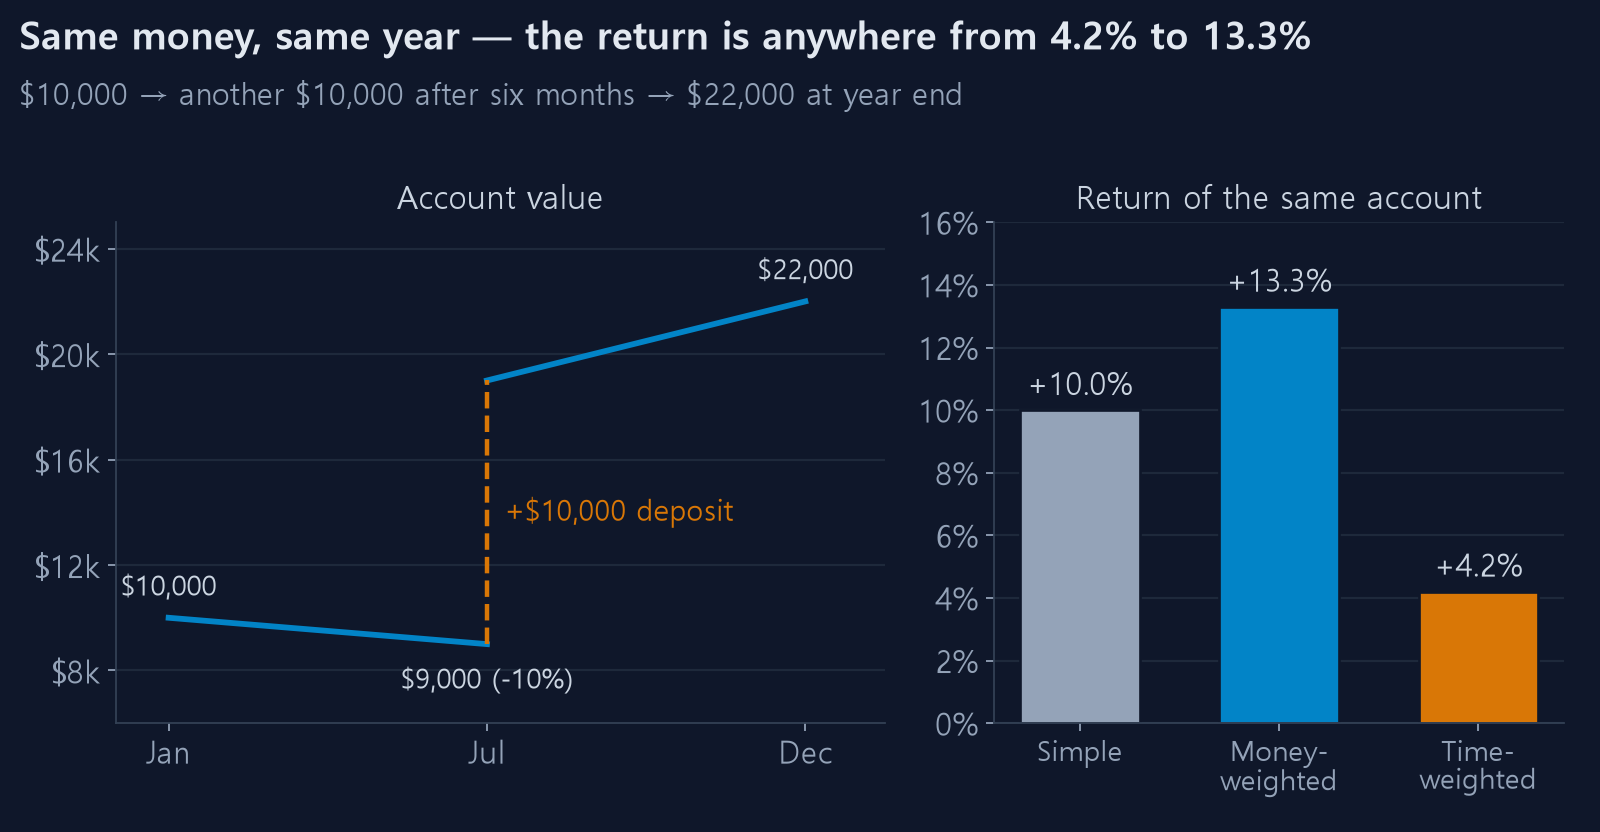
Same account, same period, same money — and a range from 4.2% to 13.3%.
All three are correct. They answer different questions. When someone says "I made 13%", the conversation goes nowhere until you ask which one.
Which one for maximum drawdown?
Time-weighted. The reason is simple.
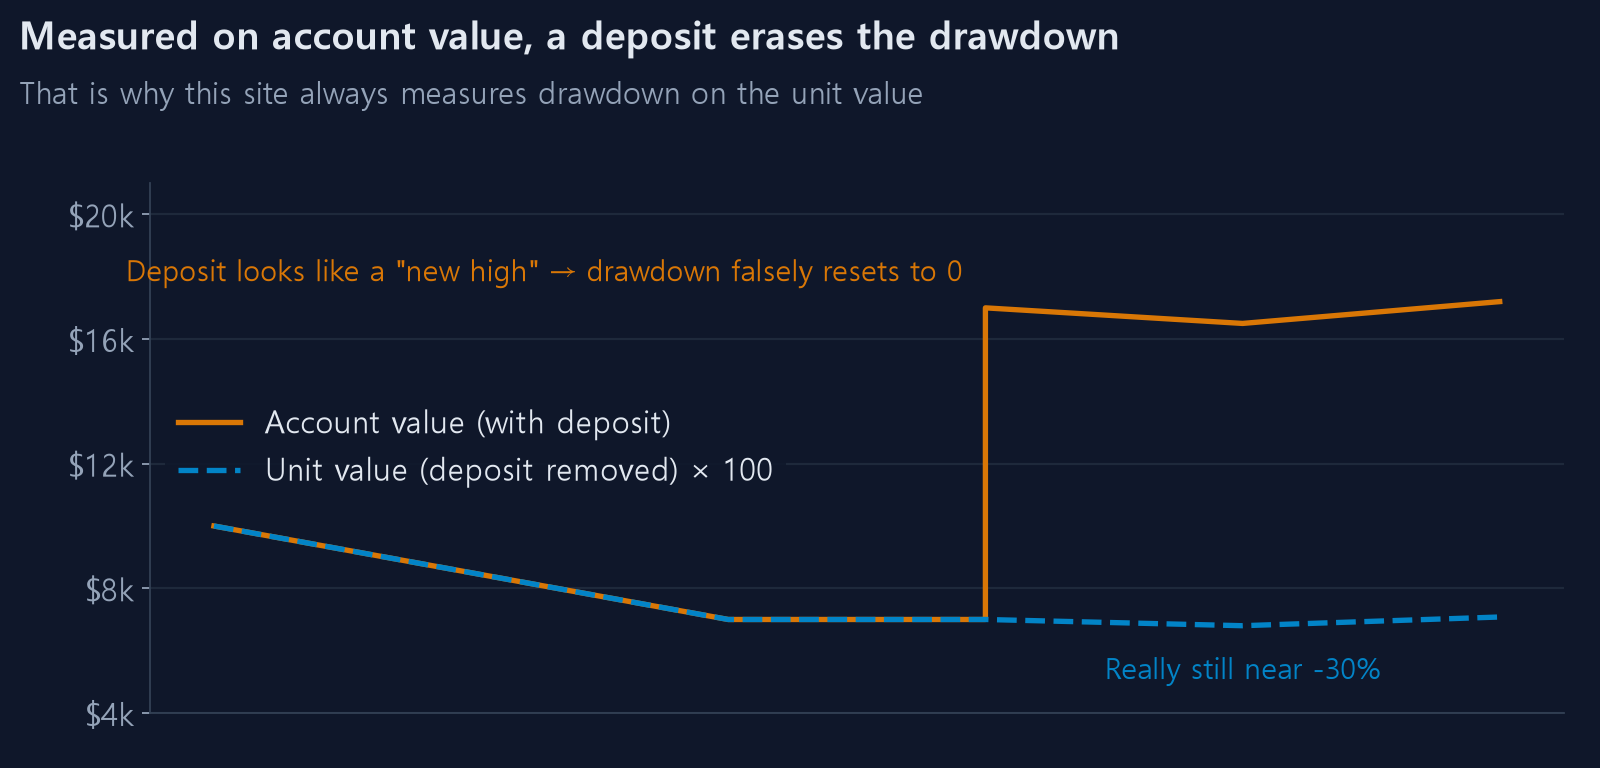
Adding money makes the account value jump that day. Leave that jump in and it looks like a recovery from the drawdown, when all that happened is a deposit.
Concretely: an account falls from 10,000 to 7,000 (−30%). Add 10,000 and the value is 17,000. Looking only at the value curve, it appears to have made a new high, and the drawdown resets to zero.
Time-weighting removes inflows, so the illusion never appears. This site computes maximum drawdown that way.
Why percentages alone mislead
Whichever method you use, percentages improve as the denominator grows.
A 16% loss on $10,000 is $1,600. Put in $50,000 and take an 11% loss and the percentage looks better while the money lost is $5,500. That is not losing less; it is dilution.
This is the most common illusion in averaging down. "My loss percentage improved" almost always means "I added money, so the denominator grew."
That is why this site reports averaging-down results with the profit and loss in currency and the deepest unrealised loss in currency alongside the percentages. They frequently point in opposite directions.
Which to look at when
| Question | Measure |
|---|---|
| How much did my money actually grow? | Simple return + P&L in currency |
| How efficiently was capital used? | Modified Dietz |
| Was the strategy any good? | Time-weighted |
| Was it survivable? | Time-weighted drawdown + loss in currency |
Look at only one and you will be fooled somewhere. Especially with anything that adds capital along the way.
When reading someone else's numbers
If you see "80% return this year" posted somewhere, check three things.
- Did they add money? If so it is probably a simple return, and the actual performance was lower.
- What is the denominator? Whole portfolio or just that account changes it by multiples.
- What was the maximum drawdown? Without it, nothing else means anything.
Why maximum drawdown matters more than return covers the last point.