Note — the S-series (SOXL ladder) strategies mentioned here are from the time of the research and are no longer in the site's strategy list (A, D, B, G and I families). See the strategy guide for the current ones.
Earlier S-family strategies on this site decided when to buy using the ratio of VIX to VIX3M rather than VIX on its own. None of the current strategies use it, and the site no longer collects VIX data. The ratio is still worth understanding, so here is why it was used and whether it held up.
The difference between the two
- VIX — expected volatility over the next 30 days
- VIX3M — expected volatility over the next three months
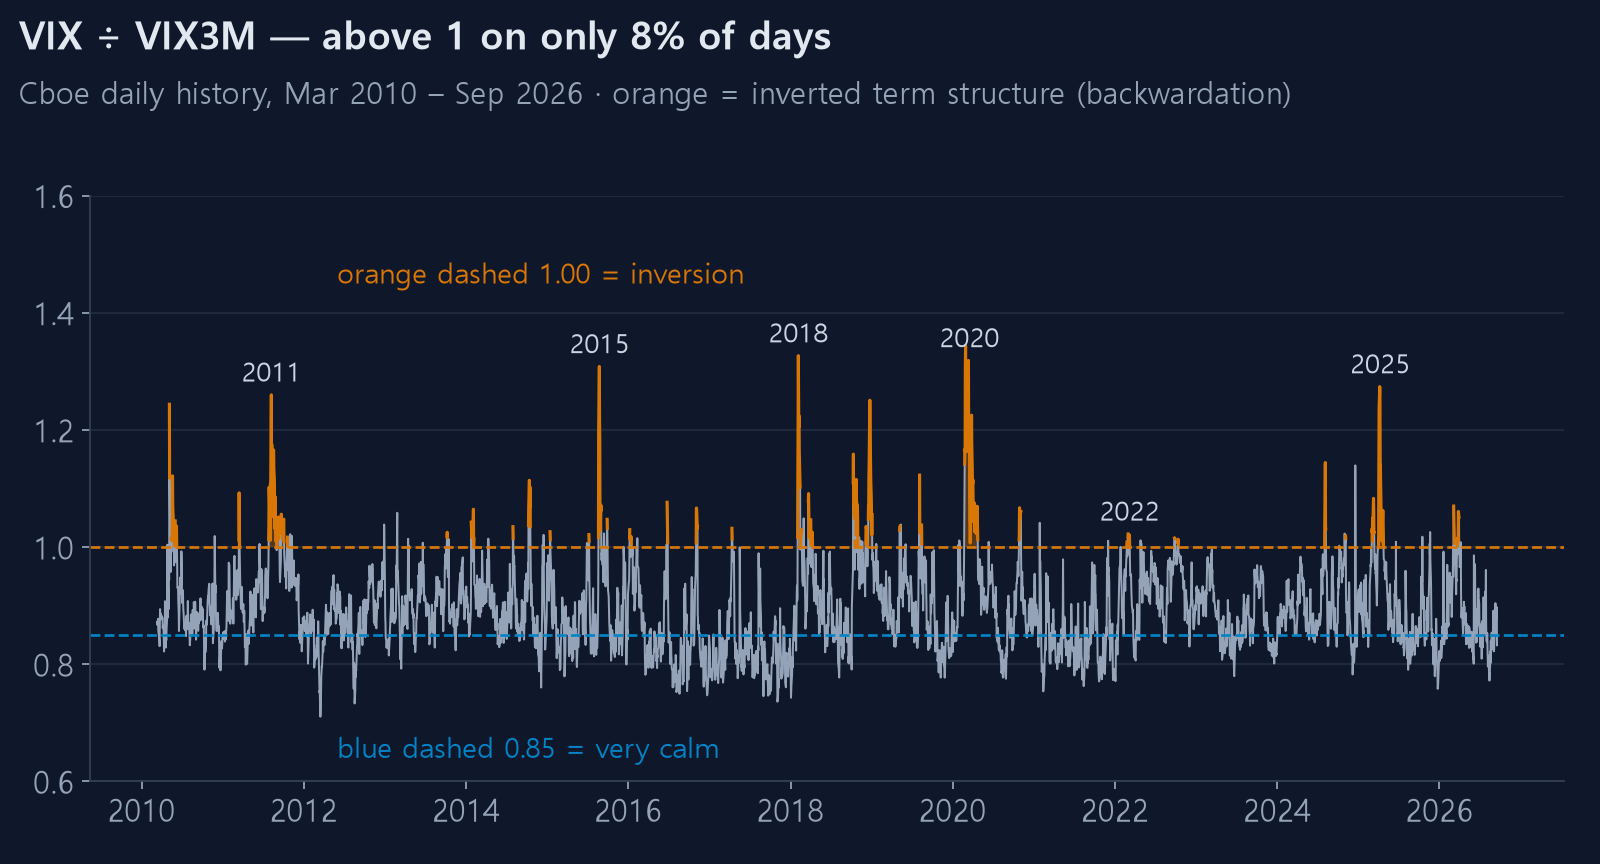
Normally VIX3M sits above VIX, because the further out you look the less you know. This is contango, and the ratio VIX ÷ VIX3M usually runs between 0.85 and 0.95.
When markets panic, the next 30 days start to look scarier than the next three months. VIX rises above VIX3M and the ratio crosses 1. That is backwardation, or an inverted term structure.
The key point: the level of VIX tells you the market is frightened. The ratio tells you whether the market expects the fear to last. A ratio above 1 means the market thinks things are terrible now but will calm down within three months. That tends to be near the bottom.
What the data shows
We took all 4,154 sessions since SOXL listed (2010-03 to 2026-09), bucketed them by the ratio, and measured the subsequent one- and three-month returns. The bucket is assigned on the prior close, so there is no lookahead.
| VIX ÷ VIX3M | Sessions | Next 1M avg | Next 3M avg | 3M positive rate |
|---|---|---|---|---|
| Below 0.85 (very calm) | 1,218 | +4.0% | +10.1% | 62.4% |
| 0.85 – 0.95 (normal) | 2,141 | +4.6% | +15.1% | 64.0% |
| 0.95 – 1.00 (tense) | 477 | +7.9% | +27.7% | 68.1% |
| 1.00 – 1.10 (inverted) | 248 | +15.7% | +44.2% | 70.2% |
| Above 1.10 (extreme fear) | 69 | +13.0% | +44.9% | 75.4% |
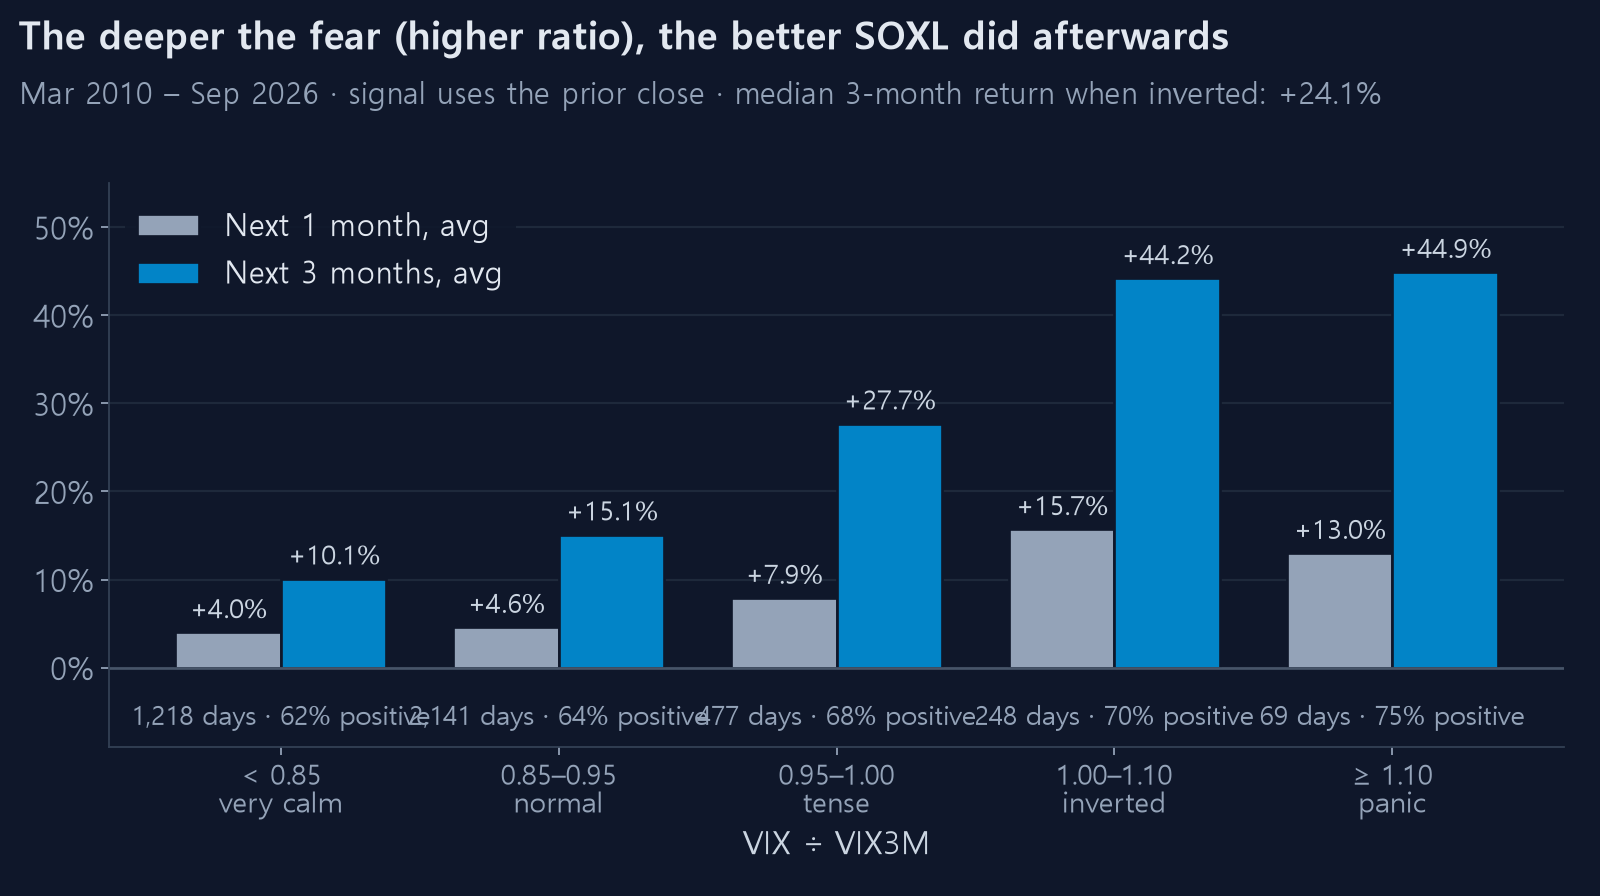
The relationship is monotonic. The more inverted the curve, the better the forward return.
Three-month returns after the 248 inverted sessions averaged +44.2%, nearly three times the normal-regime figure, with the highest positive rate of any bucket.
Reading these numbers carefully
Mean versus median
The inverted bucket's three-month mean is +44.2% but its median is +24.1%. The mean sits well above the median, meaning a handful of enormous rallies pulled it up.
So the accurate statement is not "inversion means +44%". It is "inversion raises the odds of a large gain well above normal, with very wide dispersion inside that."
These are 3x leveraged numbers
SOXL is three times the semiconductor index. Run the same analysis on SPY and the magnitudes shrink considerably. The ordering of the buckets holds; the size does not transfer.
Inversion does not mark the bottom
Inversion is a period, not a point — 248 sessions of it. In March 2020 it persisted for weeks, and SOXL fell another 60% inside that window. Putting everything in on the first inverted day would have meant a severe loss before the recovery.
This is exactly why it belongs inside a split-buying rule: increase the size during inverted periods, but never commit everything at once.
How the earlier strategies used it
The earlier S-family (SOXL ladder) strategies read the ratio in two places.
1. Peak-fear detection (1.00 – 1.10)
When the ratio sat at or above 1.00 but below 1.10, the engine switched to attack mode even if the weekly RSI said defend. Excluding the region above 1.10 was the point: higher than that is likely a panic still in progress, and the design only wanted the moment fear crests and turns.
2. Quiet uptrend detection (below 0.85)
Conversely, when the ratio was very calm and the semiconductor index was above both its 50- and 200-day averages, the engine again overrode a defensive signal and stayed in attack. The reasoning was that nothing is actually happening, so there is nothing to defend against.
Why not just watch VIX?
Suppose VIX is 35. Is that dangerous or an opportunity? VIX alone cannot say.
- VIX 35, VIX3M 40 → ratio 0.88. Volatility is high but the structure is normal. The market expects this to continue.
- VIX 35, VIX3M 30 → ratio 1.17. Right now is scarier than three months out. The market expects this to pass.
Same VIX, opposite meaning. The ratio separates them.
Where it stands today
When this was first written (September 2026) VIX is 17.20 and VIX3M 19.36, a ratio of 0.888 — squarely normal, nowhere near inversion.
Sources and limits
VIX and VIX3M come from the official daily history published by Cboe, the index provider. VIX3M begins in September 2009, so the signal is unavailable before then.
And the samples are 248 and 69 sessions. Accounting for overlap, that is maybe ten independent events. The direction is consistent; the decimal places are not something to rely on. The habit of counting your samples applies here too.