This is the first number you have to pick. There is no right answer, but what changes is perfectly clear.
More tranches means
You can absorb a deeper decline. Six tranches means six drops to spend the seed; ten means ten. The longer the fall, the more it matters that cash remains.
But each purchase is smaller. If the bounce comes quickly, you bought less, so you earn less. $10,000 split three ways puts $3,300 into the first tranche; split ten ways, $1,000.
Average cash weight rises. That cuts both ways: drawdown shrinks, and so does return in a rising market. Idle cash is the main reason maximum drawdown on this site comes out below buy and hold.
How much cash actually sits idle
Percentage of sessions actually holding shares, SOXL over sixteen years:
| Strategy | Weights | Time invested | Avg tranches used |
|---|---|---|---|
| A1 Conservative | 5·10·15·20·25·25 | 64.3% | 2.0 |
| A2 Standard | 10·15·20·25·20·10 | 70.9% | 2.4 |
| A3 Aggressive | 16.7 × 6 | 74.2% | 2.5 |
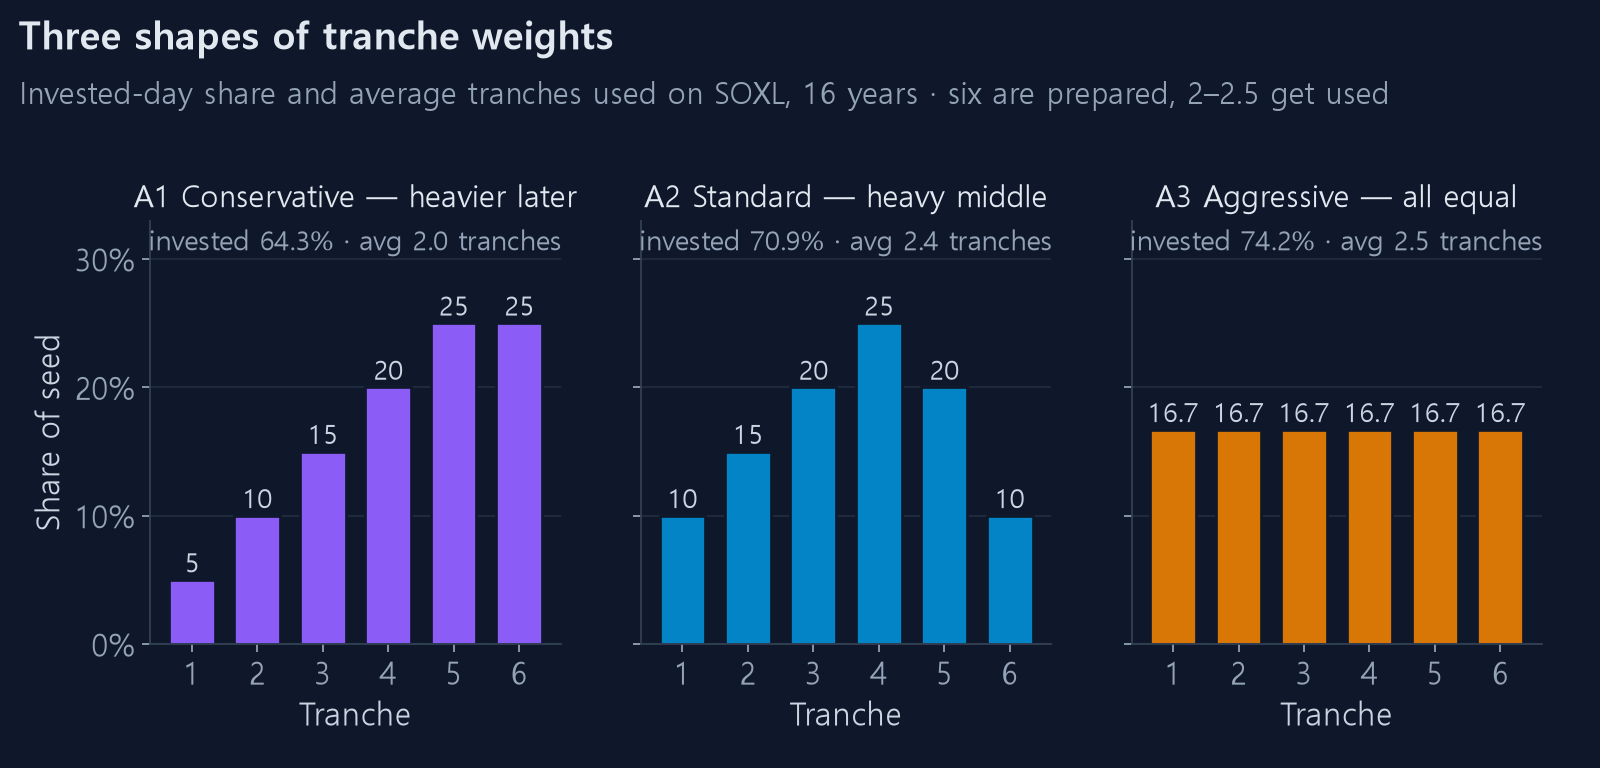
All three prepared six tranches and used an average of 2 to 2.5.
That is the key fact. Even with six available, most declines end at tranche 2 or 3. The later tranches fire a handful of times a year at best. Adding tranches is mostly buying insurance you rarely claim.
So what happens if you load the back end?
A1 puts 25% into each of the last two tranches, so half the seed is essentially never deployed. Time invested of 64.3% and last place on return (23.3% a year) is the price.
In exchange it has the shallowest drawdown at −28.3% and zero losing years across seventeen. Covered in detail in what tranche weights actually change.
A small seed caps how far you can split
The most practical constraint. This site buys whole shares only.
Assume a $10,000 seed and SOXL at $120:
| Split | First tranche | Shares affordable |
|---|---|---|
| 3 | ~$3,300 | 27 |
| 6 | ~$1,000 | 8 |
| 10 | ~$600 | 5 |
Ten works here. But on a $500 stock, ten tranches means $600 in the first tranche and you cannot buy a single share. That is what produces a "no trades at all" result.
Seed ÷ tranches should be at least three to five times the share price for the buying to be meaningful.
A second problem appears with small share counts. Buying eight shares and taking a 1.5% target earns about 12% of one share price, and a 0.2% round-trip fee sits on top. The fewer shares, the larger the fee share of the profit.
The profit target matters more than the tranche count
Many people spend their thinking time on the split count when the profit target changes far more. With six tranches held constant:
| Target | Win rate | Final return |
|---|---|---|
| 0.01% | 86.0% | 3,048% |
| 1.5% | 80.8% | 13,760% |
| 2.0% | 81.0% | 20,053% |
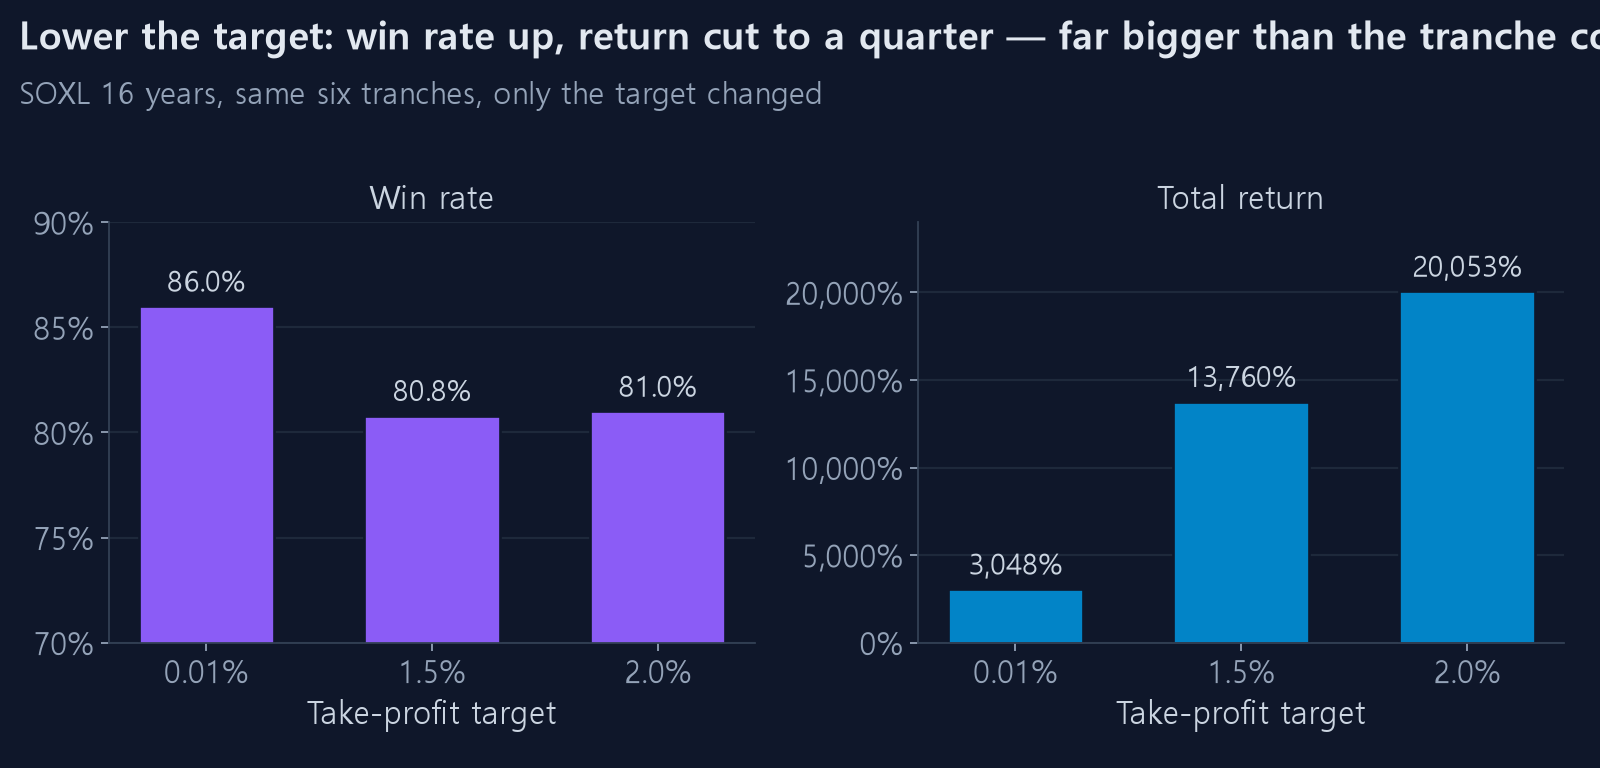
Lowering the target raises the win rate and lowers the return. Moving from six tranches to eight does not produce anything like this spread.
The right order is profit target → time cut → tranche count.
How to shape the weights
As important as the count is how much each tranche gets. Three default shapes:
Standard (diamond) 10, 15, 20, 25, 20, 10 — heaviest in the middle, which is where
declines most often end. Hence the default.
Conservative 5, 10, 15, 20, 25, 25 — back-loaded. Prepared for deep declines, earns
little in shallow ones.
Aggressive (flat) 16.7 × 6 — all equal. Simple and predictable. Commits heavily from
the first tranche, so it is best in rallies and worst in declines.
Back-loaded suits a market about to fall hard; the diamond suits repeated shallow dips. There is no way to know in advance which you are in, so it is better to run several periods and pick a setting that never collapses badly in any of them.
The answer changes with the ticker
More volatile tickers use more tranches. SOXL averages 2.4; run the same strategy on SPY, with roughly half the volatility, and the average falls further. Many tranches on a calm ticker is waste.
Conversely, on something moving more than 10% a day, six tranches may not be enough. Change the ticker and revisit the count.
Comparing directly
⚡ Compare all loads every saved strategy at once. Save a few that differ only in tranche count and run them over the same period.
Then use 📊 Compare 30Y for the year-by-year view, which shows how each count behaves in good and bad years. Export the result as CSV or an image to keep.
As close to a conclusion as we get
- More tranches means stronger in deep declines, weaker in rallies
- But in practice only 2 to 3 get used. The rest is insurance
- A small seed caps the count. The whole-share constraint comes first
- The profit target changes results more than the tranche count does. Keep that order
- Five to seven is a reasonable starting point in most conditions
- Do not hunt for the single best value; find a region where several settings are similarly fine
If exactly one setting looks good, it is fitted to the past. See good parameters sit on a plateau and why backtests look better than reality.