You have probably heard that a 3x ETF is only 3x for one day. So what was it actually? We measured it with the data on this site.
Daily, it was exactly 3x
Regressing each leveraged product's daily return on its underlying index:
| Product | Underlying | Period | Daily multiple |
|---|---|---|---|
| SOXL | SOXX | 2010-03 – 2026-09 | 2.96 |
| TQQQ | QQQ | 2010-02 – 2026-09 | 2.96 |
| UPRO | SPY | 2009-06 – 2026-09 | 2.98 |
| UDOW | DIA | 2010-02 – 2026-09 | 2.95 |
All close to 3.00. The issuers delivered what they promised. The small shortfall to 2.95–2.98 is the expense ratio and financing cost.
Long term, it was not 3x at all
Annualised returns over the same periods:
| Product | Underlying CAGR | If 3x | Actual CAGR | Shortfall |
|---|---|---|---|---|
| SOXL | 23.2% | 69.5% | 35.8% | −33.7pp |
| TQQQ | 18.3% | 54.9% | 41.5% | −13.4pp |
| UPRO | 13.0% | 39.0% | 32.0% | −7.0pp |
| UDOW | 10.3% | 30.9% | 24.9% | −6.0pp |
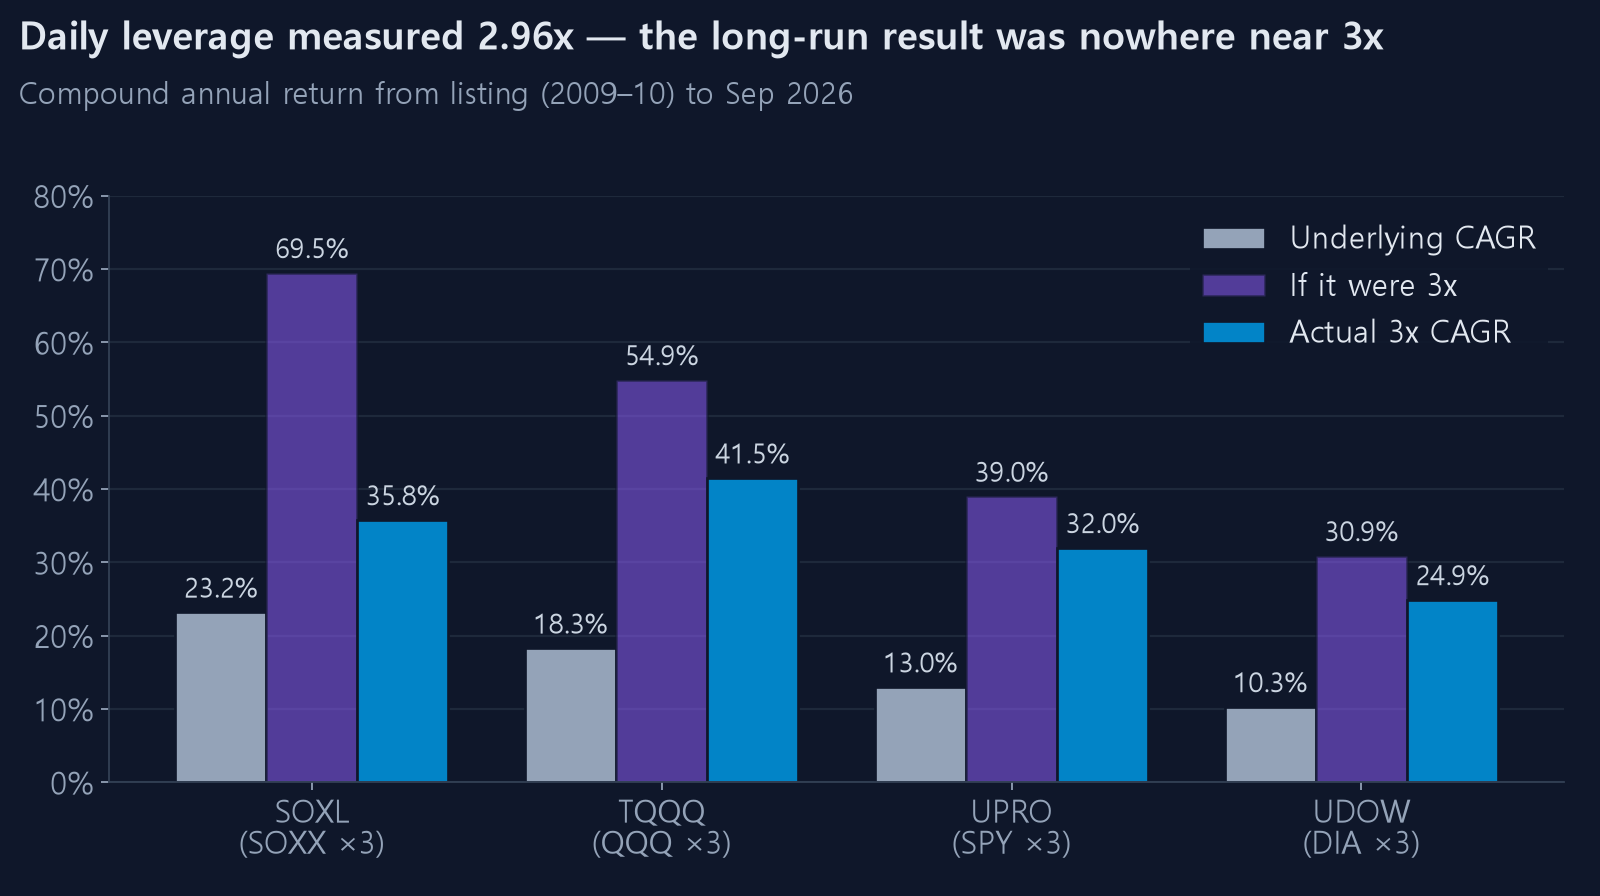
SOXL delivered about half of what a naive 3x would suggest. UPRO and UDOW came fairly close.
Why the difference?
Volatility is the culprit
| Product | Underlying volatility | Theoretical drag | Actual shortfall |
|---|---|---|---|
| SOXL | 30.9% | 28.6pp | 33.7pp |
| TQQQ | 20.7% | 12.8pp | 13.4pp |
| UPRO | 17.1% | 8.8pp | 7.0pp |
| UDOW | 16.4% | 8.1pp | 6.0pp |
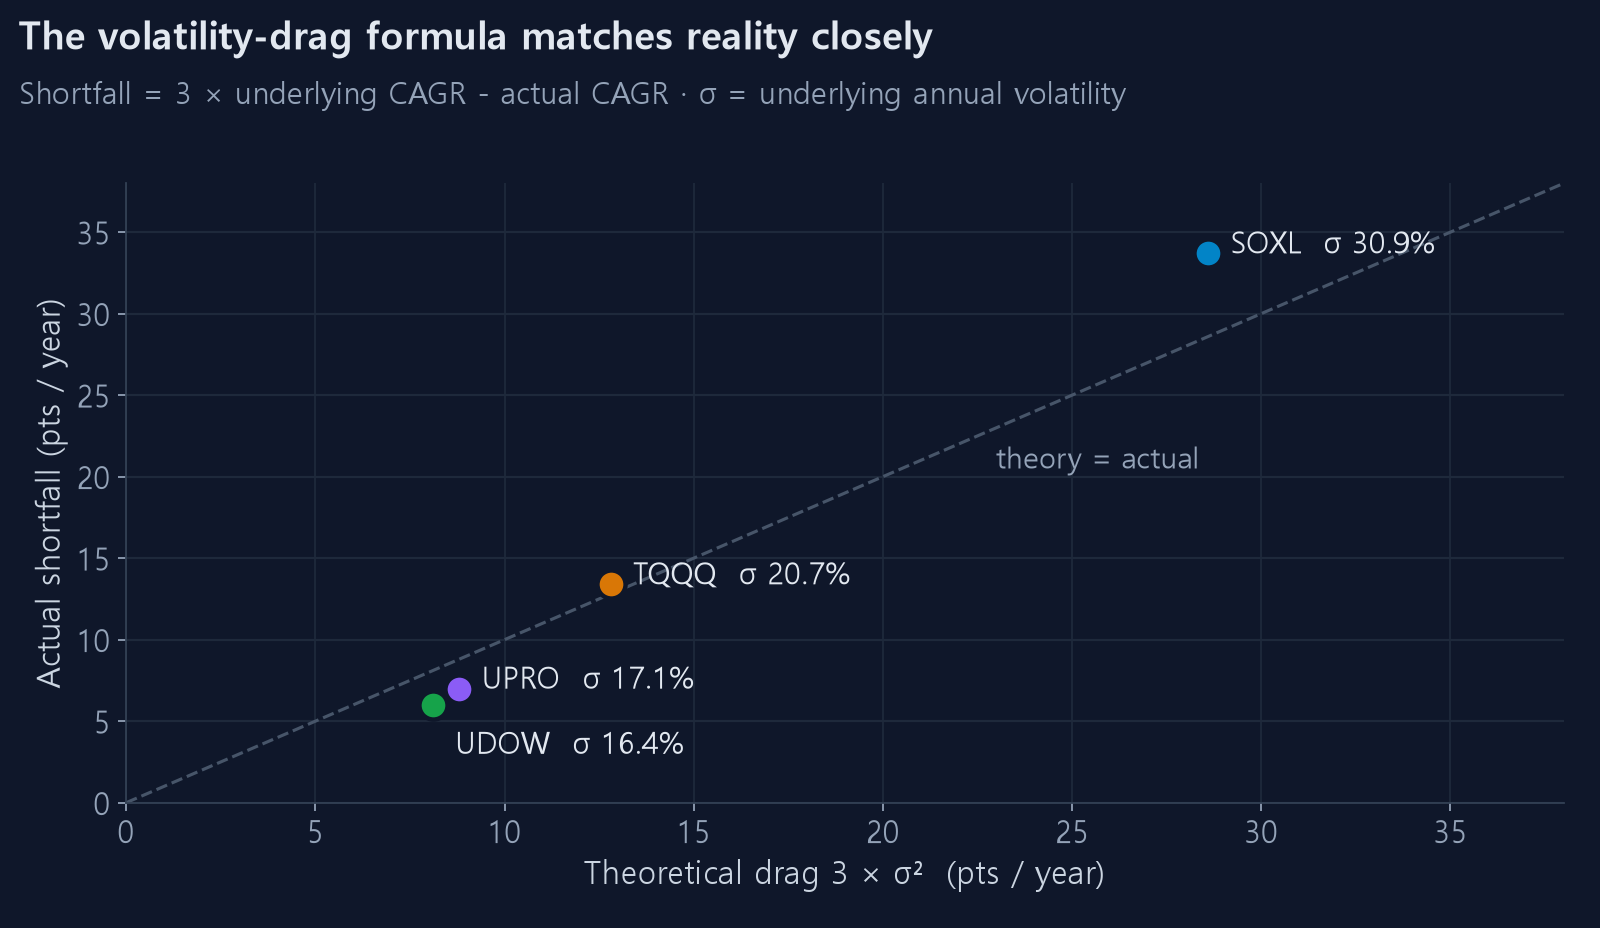
Theory and measurement line up. This is structural, not coincidence.
Long-run drag on a leveraged product is approximated by:
drag ≈ (L² − L) / 2 × σ²
L is the leverage factor and σ the underlying's annualised volatility. At L = 3 the coefficient is (9−3)/2 = 3, so:
drag ≈ 3 × σ²
Plugging in SOXX's 30.9%: 3 × 0.309² = 28.6pp, which is the table value.
Volatility enters squared. Double the volatility and the drag quadruples. SOXX (30.9%) and DIA (16.4%) differ by about 1.9x in volatility but 3.5x in drag.
Why it happens — two lines of arithmetic
Start at 100, gain 10%, then lose 10%.
Underlying - 100 → 110 → 99 - Result: −1.0%
3x product (three times each day's return) - 100 → 130 → 91 - Result: −9.0%
The index is down 1% and the 3x is down 9%, not 3%. The index came back to where it started and the leveraged product did not.
Going up then down means falling from a larger base; going down then up means rising from a smaller one. That accumulates every single day.
So should you avoid them?
Not necessarily. Look again: SOXL's actual 35.8% CAGR is far above its underlying's 23.2%. It beat the index despite paying the full drag.
Drag runs in reverse during a strong one-directional trend: rising from a larger base after each gain compounds faster than 3x. Choppy markets punish you; trending markets amplify you.
Since 2010 both semiconductors and the Nasdaq have trended strongly upward, which is why they came out ahead. Keep in mind how unusual that period was.
Drawdown is the real problem
More important than return. Average yearly maximum drawdown from this site's data:
| Product | Avg MDD | Worst year |
|---|---|---|
| SOXL | −56.4% | −89.9% |
| TQQQ | −39.7% | −80.2% |
| UPRO | −33.3% | −76.6% |
| SOXX (underlying) | −26.8% | −65.9% |
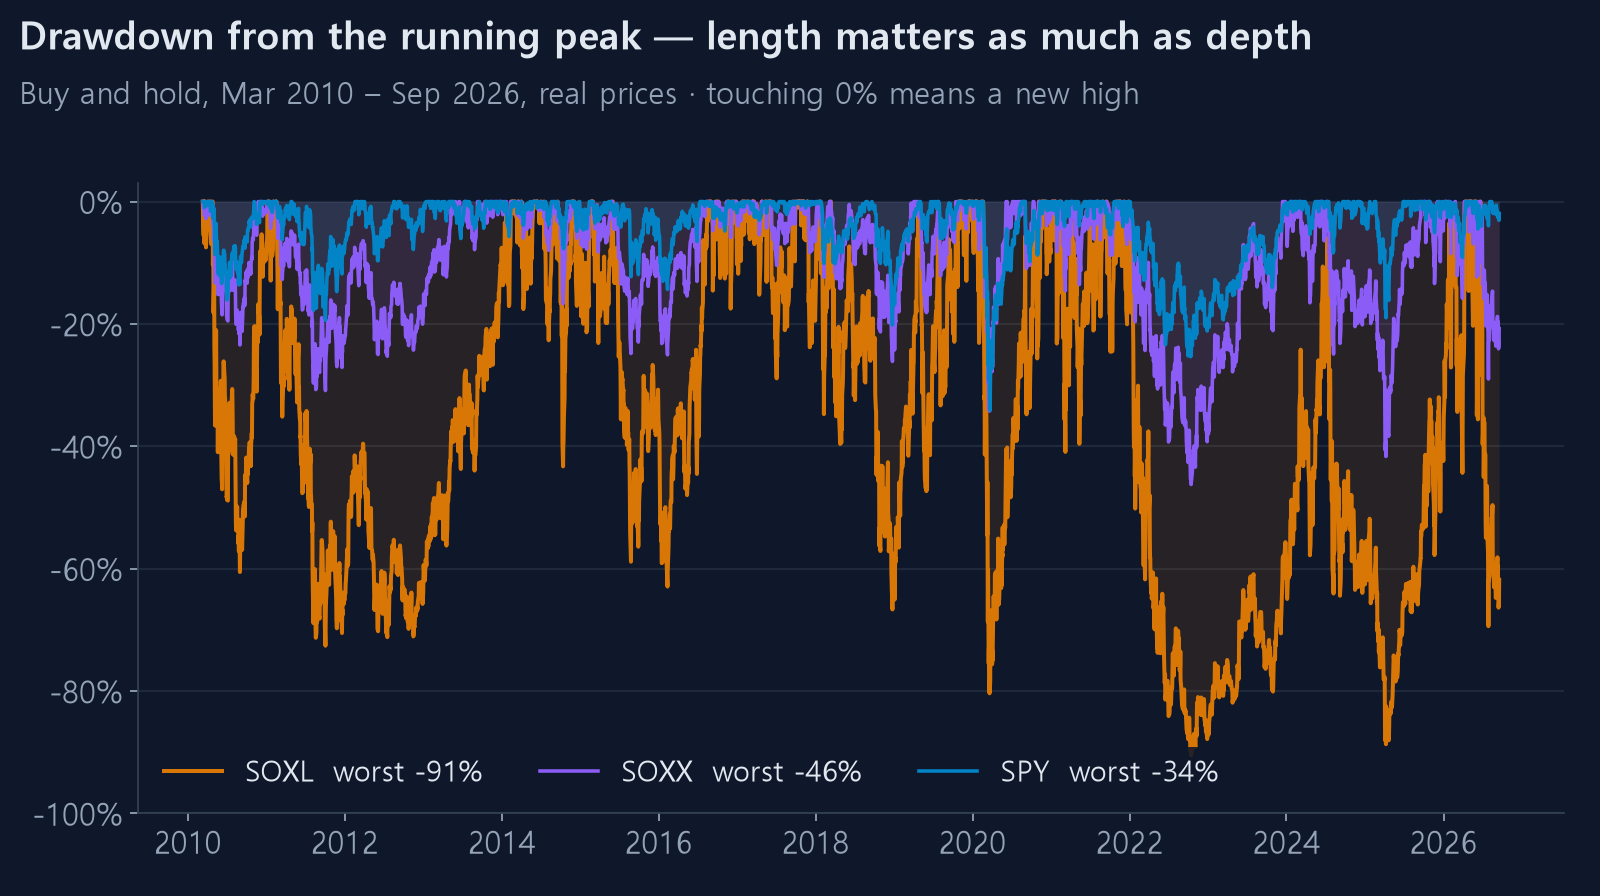
−89.9% means $10,000 became $1,010. Recovering the original requires a 890% gain.
And that figure is on a yearly reset basis. Buying at the end of 2021 and holding through 2022 was worse.
Practical conclusions
- The 3x tracking works. There is nothing to suspect in the issuers
- Long-run multiple is set by the underlying's volatility. Leveraged products on calmer indices (Dow, S&P) hold up better over time
- Sideways markets do the most damage. Directionless chop is the worst case
- Read the drawdown first. A great return you cannot sit through belongs to someone else
What this has to do with split buying
This is why the site exists. Hold a 3x product outright and you eat the −90%. Split buying keeps cash on the sidelines most of the time and brings the same ticker's drawdown down to roughly −23%.
It also cuts the return by more than half. Whether that trade is worth it, ticker by ticker, is in seventeen leveraged ETFs run through the same rule.
The derivation of the drag formula is in the maths of volatility drag.