Answering "which ticker is best?" with a return figure tells half the story. Here are all seventeen tickers on this site run through the same rule, the same seed and the same fee, with drawdown and losing years shown next to the return.
How it was run
- Strategy: A2 Standard (six tranches, weights 10·15·20·25·20·10, entry −0.01%, target 1.5%, time cut 10 sessions)
- Method: reset to $10,000 on the first session of each year, so early-listed tickers get no compounding advantage
- Costs: 0.1% each way, whole shares only, limit-on-close fills
- Benchmark: buy and hold over the same years
- Data: real prices after listing only. The live 30-year report now fills the years before listing with index-based prices built from the 1x index, so it shows more years than this table and marks them "index-based"
Every figure is a yearly average.
Full results
| Ticker | Years | Strat. return | Strat. MDD | Losing yrs | Hold return | Hold MDD | Losing yrs |
|---|---|---|---|---|---|---|---|
| SOXL semis 3x | 17 | 35.5% | −23.0% | 1 | 65.8% | −56.4% | 6 |
| TECL tech 3x | 18 | 25.8% | −16.8% | 0 | 60.0% | −42.2% | 3 |
| SPYU S&P 4x | 3 | 23.0% | −19.1% | 0 | 33.4% | −43.1% | 0 |
| GDXU gold miners 3x | 7 | 21.3% | −30.2% | 2 | 69.3% | −63.7% | 5 |
| TQQQ Nasdaq 3x | 17 | 21.3% | −16.8% | 1 | 57.7% | −39.7% | 3 |
| UPRO S&P 3x | 18 | 12.1% | −18.2% | 3 | 38.0% | −33.3% | 4 |
| UDOW Dow 3x | 17 | 10.6% | −17.9% | 4 | 29.1% | −32.6% | 4 |
| SOXX semis | 26 | 8.1% | −13.4% | 6 | 16.9% | −26.8% | 10 |
| KORU Korea 3x | 14 | 8.0% | −32.7% | 7 | 34.7% | −57.1% | 6 |
| QQQ Nasdaq 100 | 28 | 6.1% | −10.1% | 6 | 13.2% | −20.1% | 6 |
| TMF long bonds 3x | 18 | 4.9% | −16.4% | 7 | 0.8% | −37.6% | 11 |
| VOO S&P 500 | 17 | 4.4% | −7.4% | 2 | 12.2% | −12.2% | 4 |
| SPY S&P 500 | 30 | 4.0% | −9.0% | 6 | 8.9% | −15.4% | 8 |
| IWM small caps | 27 | 2.5% | −12.3% | 8 | 7.8% | −19.6% | 7 |
| SCHD dividend | 16 | 2.4% | −8.1% | 4 | 9.4% | −11.1% | 3 |
| DIA Dow 30 | 29 | 2.4% | −9.3% | 10 | 6.9% | −15.0% | 8 |
| CONL Coinbase 2x | 5 | −9.6% | −50.0% | 3 | 101.5% | −75.5% | 3 |
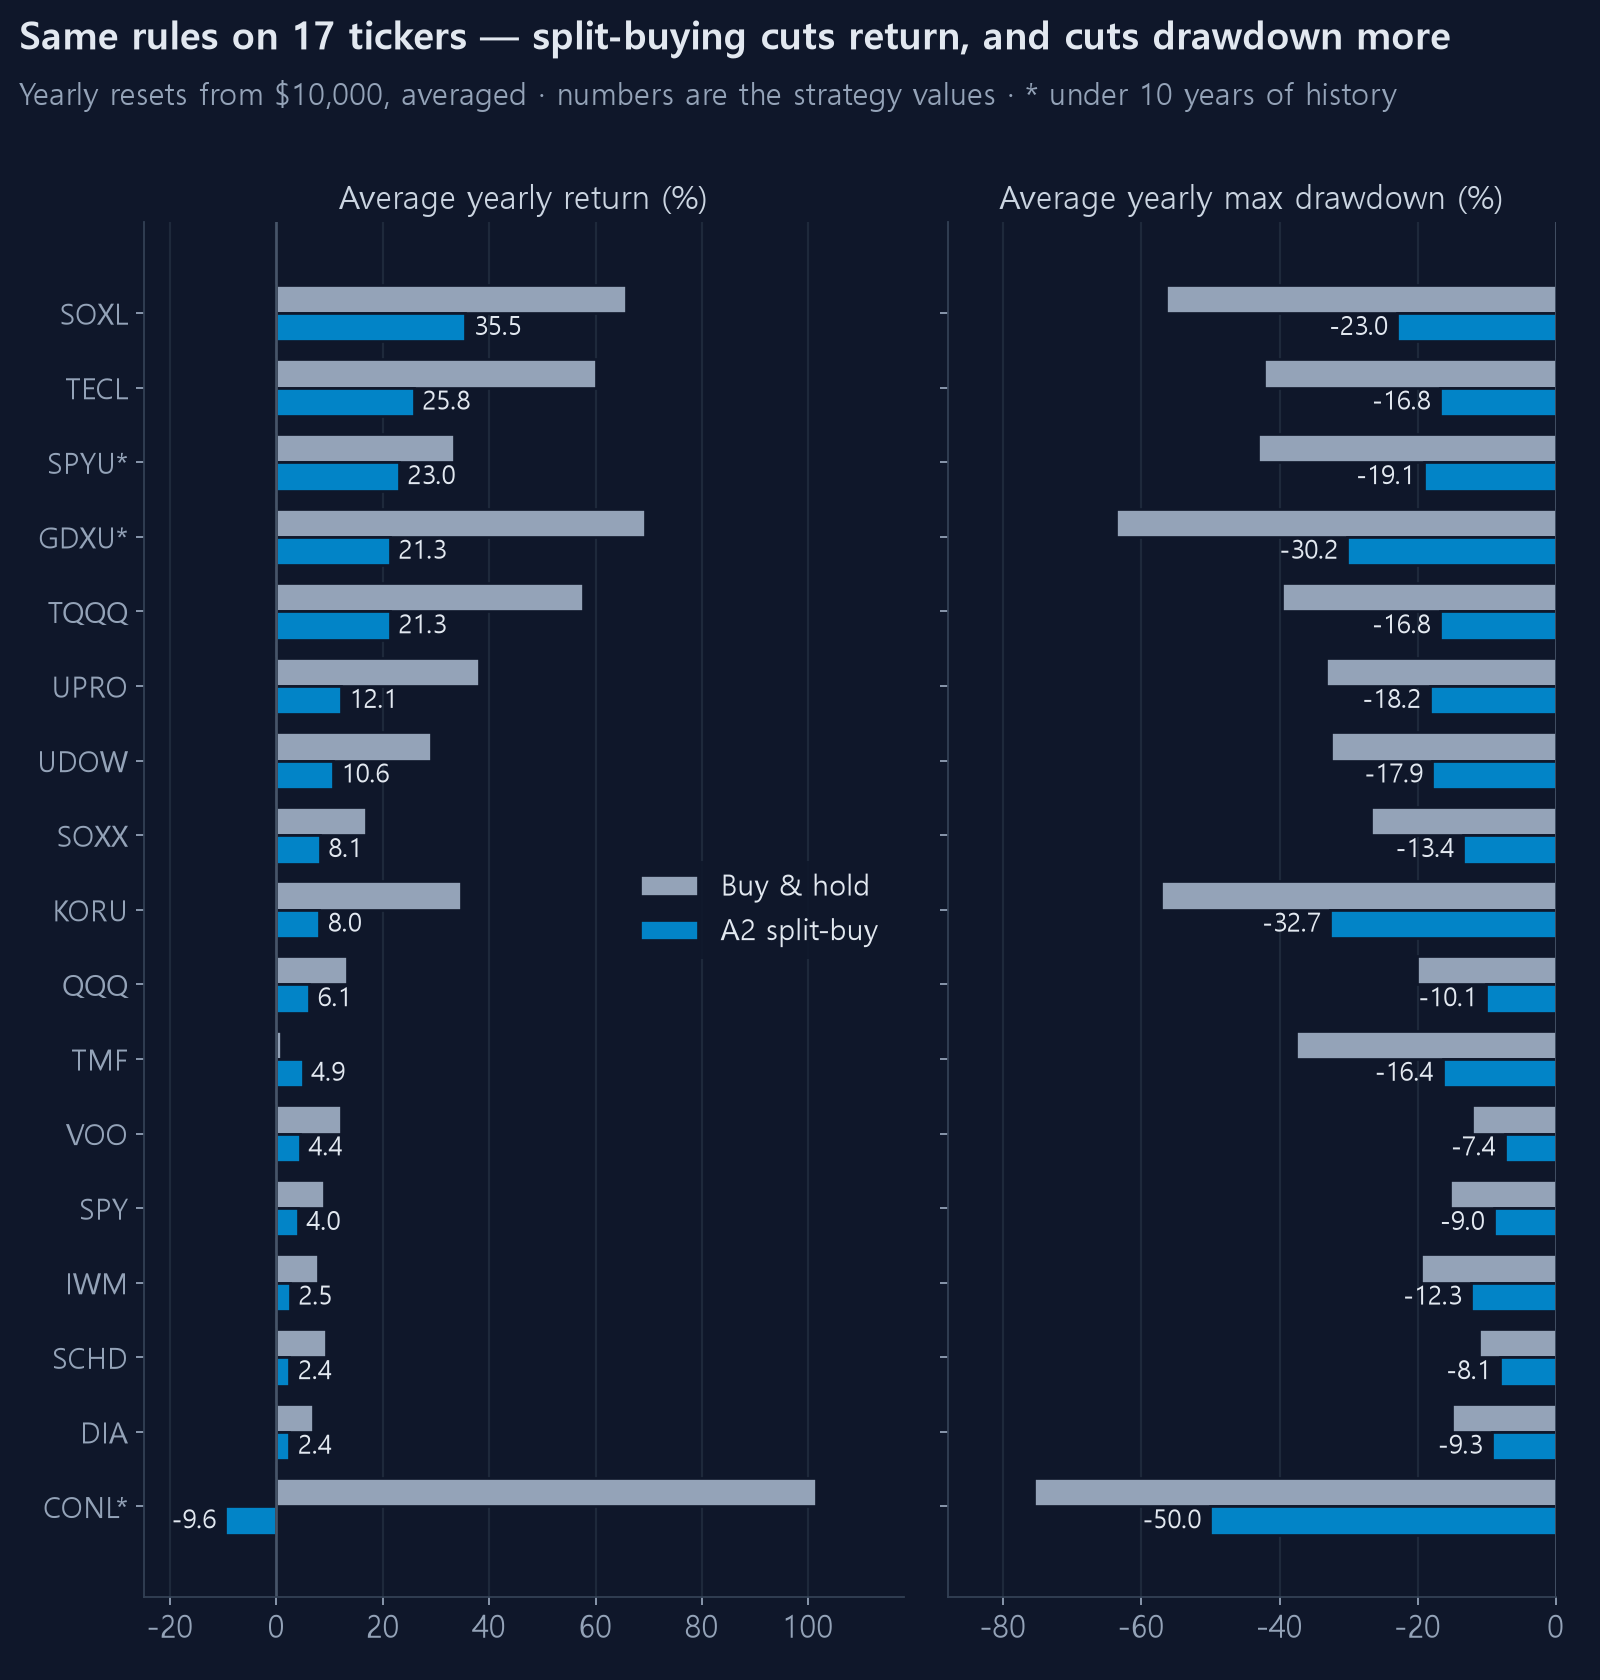
What to read here
1. Split buying cuts return, and cuts drawdown harder
On almost every ticker, the strategy returns less than buy and hold. Of course it does: split buying holds cash most of the time, and cash does not go up.
What it buys is drawdown. SOXL goes from −56.4% to −23.0%, and from six losing years to one. You give up about half the return and buy back more than half the drawdown. Whether that is a good trade depends entirely on whether you are the kind of person who can sit through a −56% year.
2. The more volatile the ticker, the better split buying works
The top of the strategy column is SOXL, TECL and TQQQ — all high-volatility 3x products. Split buying buys dips and sells small bounces, so the more the price swings, the more often it gets to do that.
On calm tickers like SPY, DIA and SCHD it manages 2–4% a year. Those are better simply held.
3. TMF is the only one where the strategy beat holding
TMF returns 0.8% a year held, and 4.9% with the strategy. It lost more than 70% in the 2022 rate-hike cycle and never recovered, so on an asset that only goes down, holding cash is itself the edge.
Note it still lost money in seven of eighteen years. It did not win; it lost less.
4. CONL is where split buying actively destroyed value
Held, it returns 101.5% a year. With the strategy, −9.6%. CONL is a 2x product on a single company whose rallies are short and violent. Split buying sells into small bounces, so it misses those rallies, then takes the crashes with every tranche filled.
Keep this row in mind as proof that split buying does not work on everything.
5. Ignore the short histories
SPYU has three years, CONL five, GDXU seven. These have not properly seen a bear market, or have only experienced one direction. Treat any row with fewer than ten years as decoration.
Sorted by drawdown efficiency
Return divided by average drawdown — "how much did I earn per point of pain?"
| Ticker | Strategy | Hold |
|---|---|---|
| SOXL | 1.54 | 1.17 |
| TECL | 1.54 | 1.42 |
| TQQQ | 1.27 | 1.45 |
| SPYU | 1.20 | 0.78 |
| UPRO | 0.66 | 1.14 |
| VOO | 0.59 | 1.00 |
| SOXX | 0.60 | 0.63 |
| SPY | 0.44 | 0.58 |
| DIA | 0.26 | 0.46 |
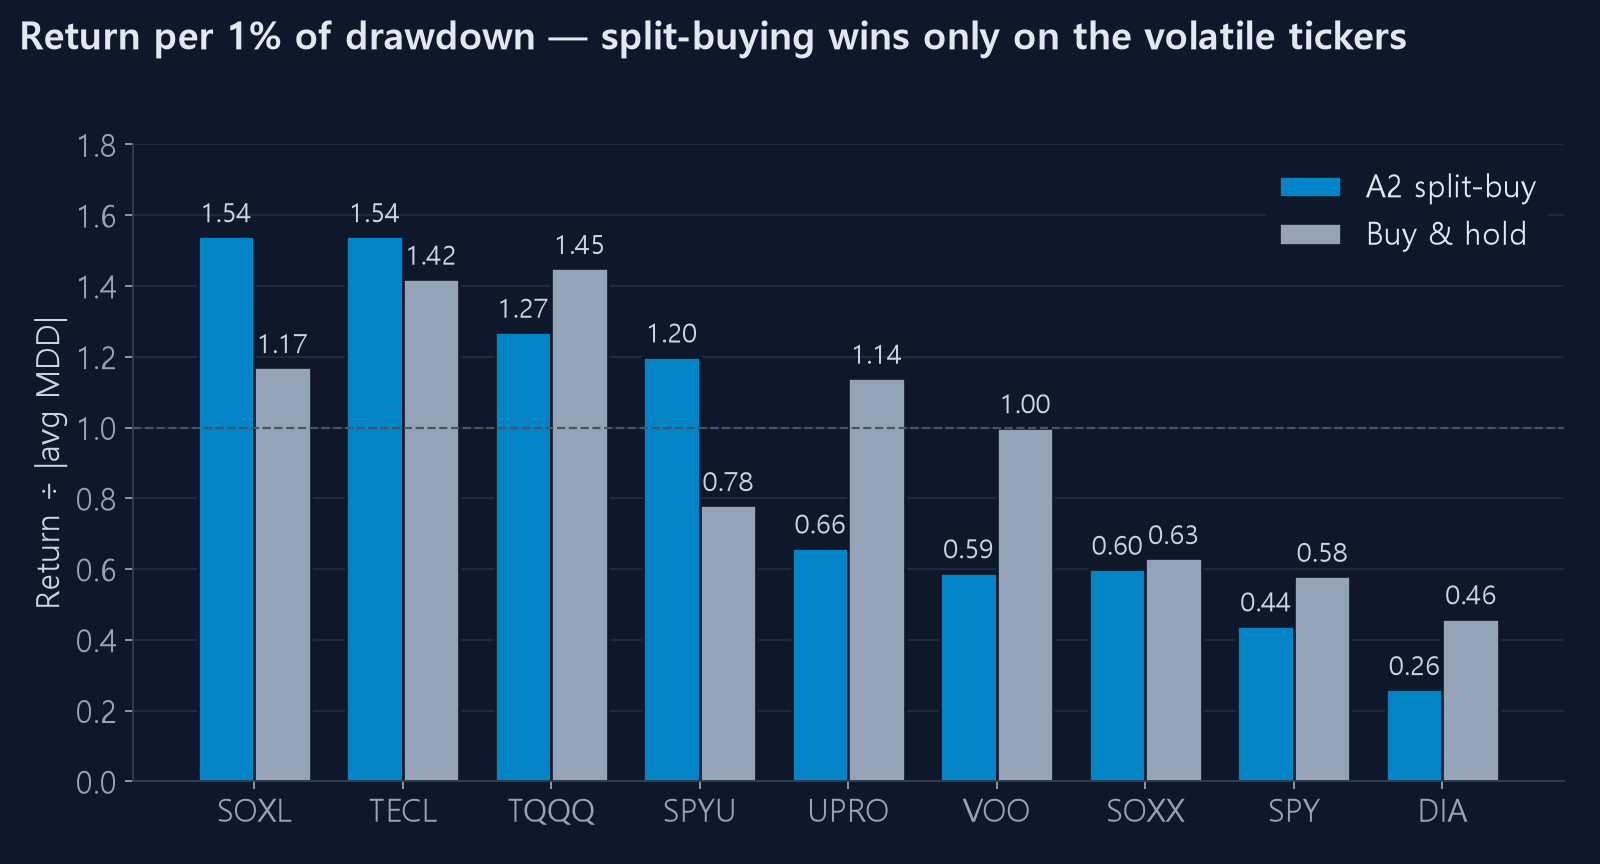
By efficiency only SOXL and TECL clearly justify the strategy; the rest land near or below simply holding.
Build this table yourself
Use ⚡ Compare all and 📊 Compare 30Y on the backtest page, switching the ticker. Export the result as CSV or an image to compare runs.
Swapping A2 for another strategy reorders the table considerably. What each strategy is built to do is covered in what tranche weights actually change.
One caveat
There are no taxes in this table, every fill is assumed perfect at the close, and delisted products never appear at all. Real results are worse. Remember that FNGU, an ETN once listed here, was redeemed early by its issuer and ceased to exist.