If you assume a 3x product delivers three times the index, backtest results stop making sense. The index is up, the 3x fund is down, and nothing explains it.
The cause is volatility drag. Work through the arithmetic once and it becomes obvious.
The 3x promise lasts one day
Read the prospectus and it says the fund tracks three times the daily return. Not the return over any longer horizon. Every evening the fund resets its exposure back to 3x.
That daily reset, combined with compounding, is where the gap comes from.
Do it by hand
Say the index gains 10%, then loses 9.09% — landing exactly where it started.
Index:   100 × 1.10   = 110
         110 × 0.9091 = 100.0     → 0%

3x fund: 100 × 1.30   = 130       (+10% × 3)
         130 × 0.7273 = 94.5      (−9.09% × 3 = −27.27%)
                                   → −5.5%
The index is flat and the 3x fund lost 5.5%. That is the drag.
Where the money went: the loss percentage applies to a larger balance than the gain did. Losing 27% of 130 is not the same amount as losing 27% of 100.
It cuts both ways
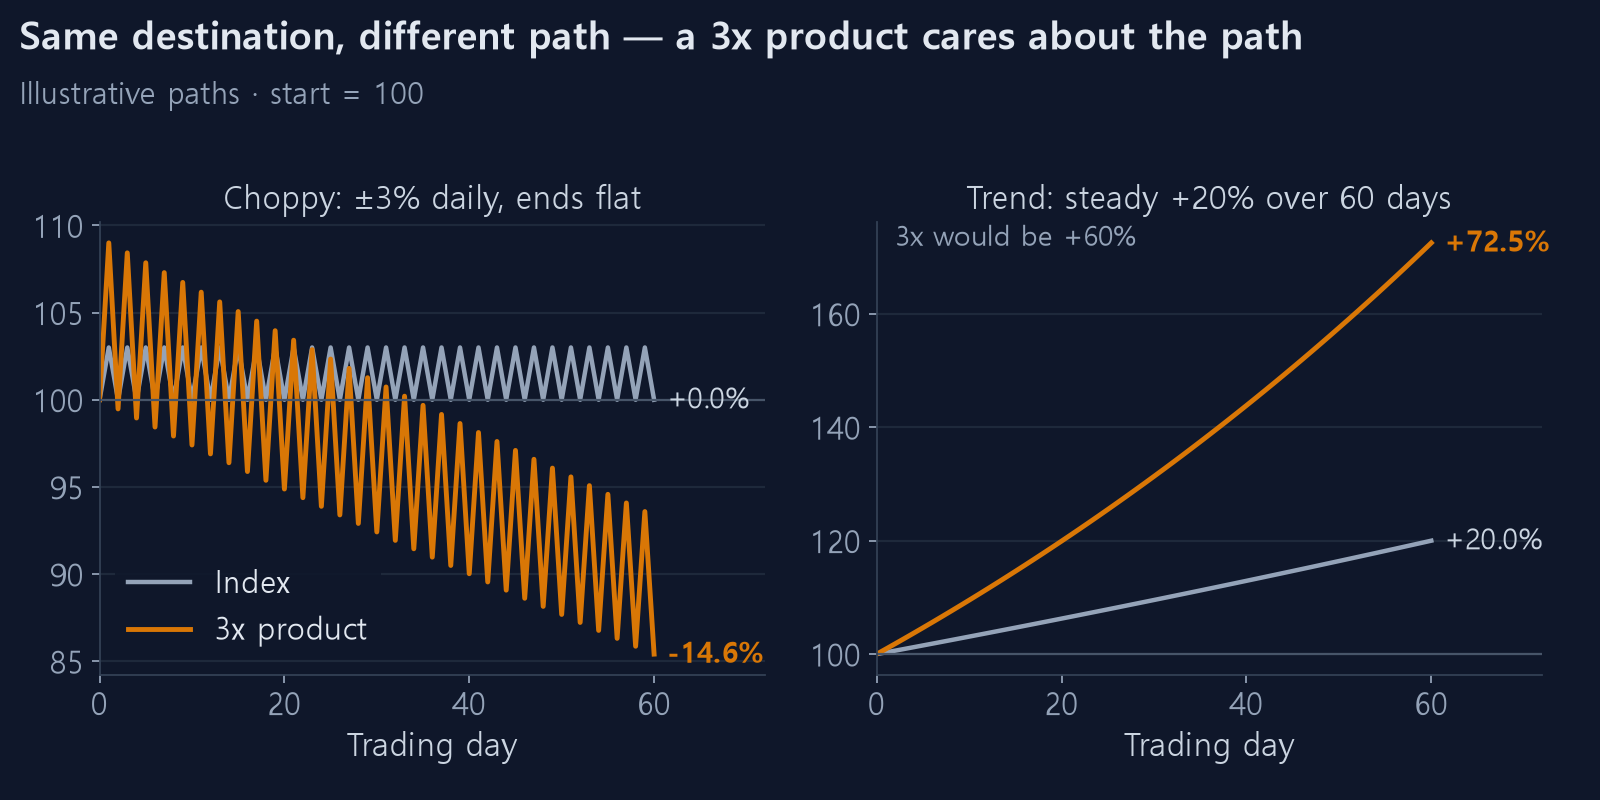
In a one-direction move, you get more than 3x.
Index:   100 → 110 → 121      (+10% twice)  → +21%
3x fund: 100 → 130 → 169      (+30% twice)  → +69%
Not 63%, which is three times 21%, but 69%. Compounding works with you and adds six points.
Leveraged products care about the path, not just the destination. Two routes to the same price produce completely different outcomes depending on how choppy the ride was.
A rough formula
With daily volatility σ and leverage L, annual drag is approximately:
annual drag ≈ L × (L − 1) / 2 × σ² × 252
σ² × 252 is annualised variance. The point is that L × (L−1) grows fast as leverage rises.
| Leverage | L × (L−1) / 2 | σ = 2% | 3% | 4% |
|---|---|---|---|---|
| 2x | 1 | −10% | −23% | −40% |
| 3x | 3 | −30% | −68% | −121% |
| 4x | 6 | −60% | −136% | −242% |
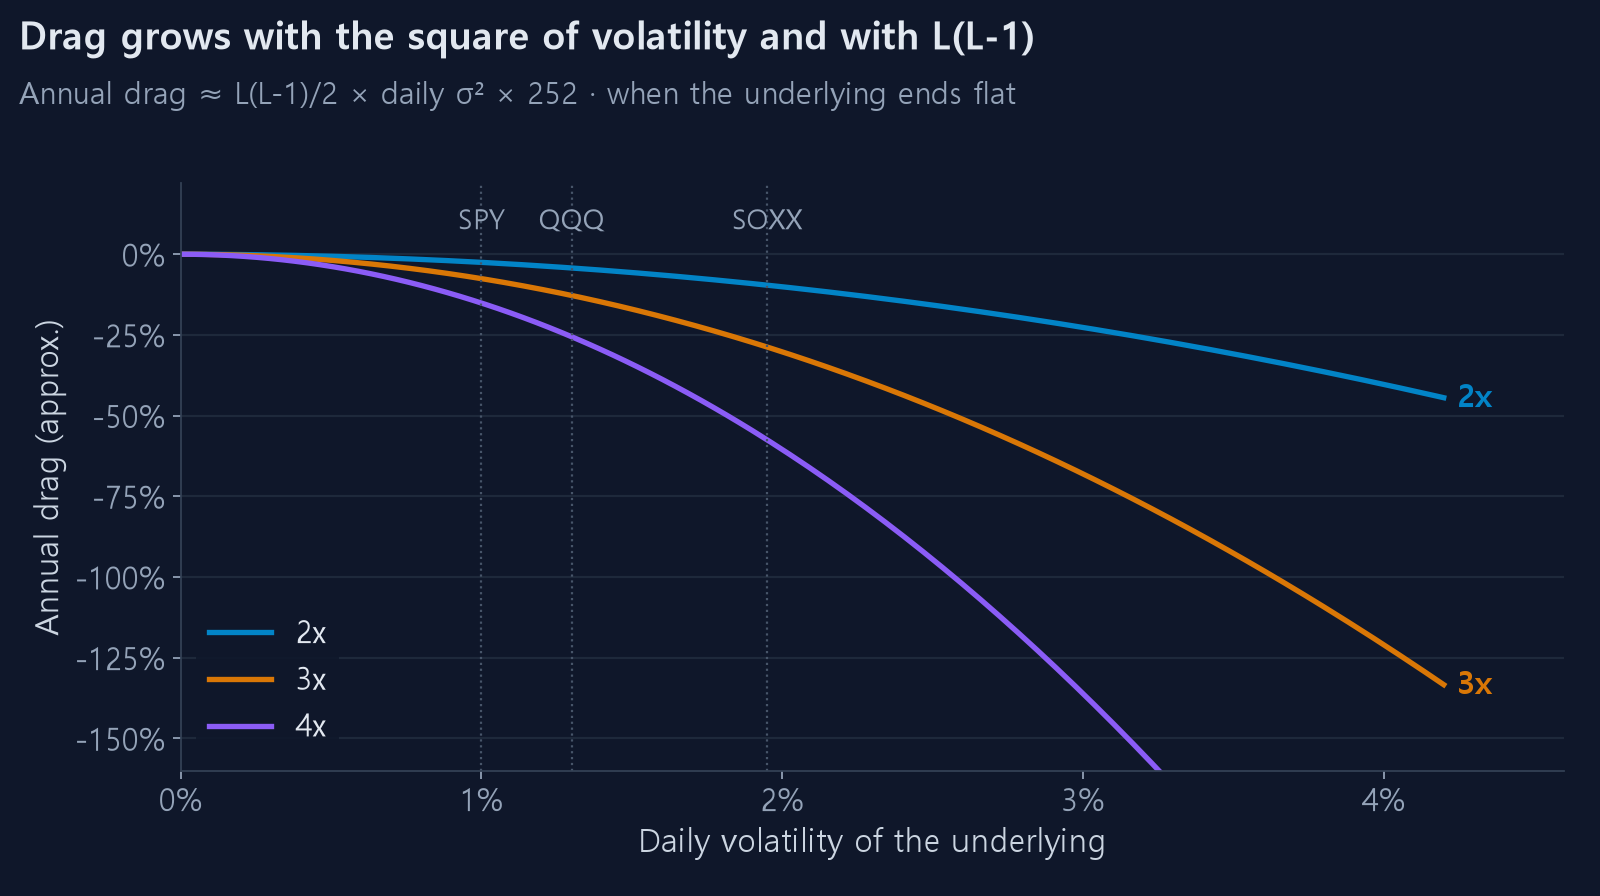
Hold a 3% daily-volatility asset at 3x and roughly 68% a year vanishes to drag even if the index ends flat. It is an approximation, and a real trend offsets part of it, but it gives you the order of magnitude.
Management fees land on top. SOXL charges around 0.75–1% a year; SPYU charges 2.95%.
Check it yourself
You can test all of this here.
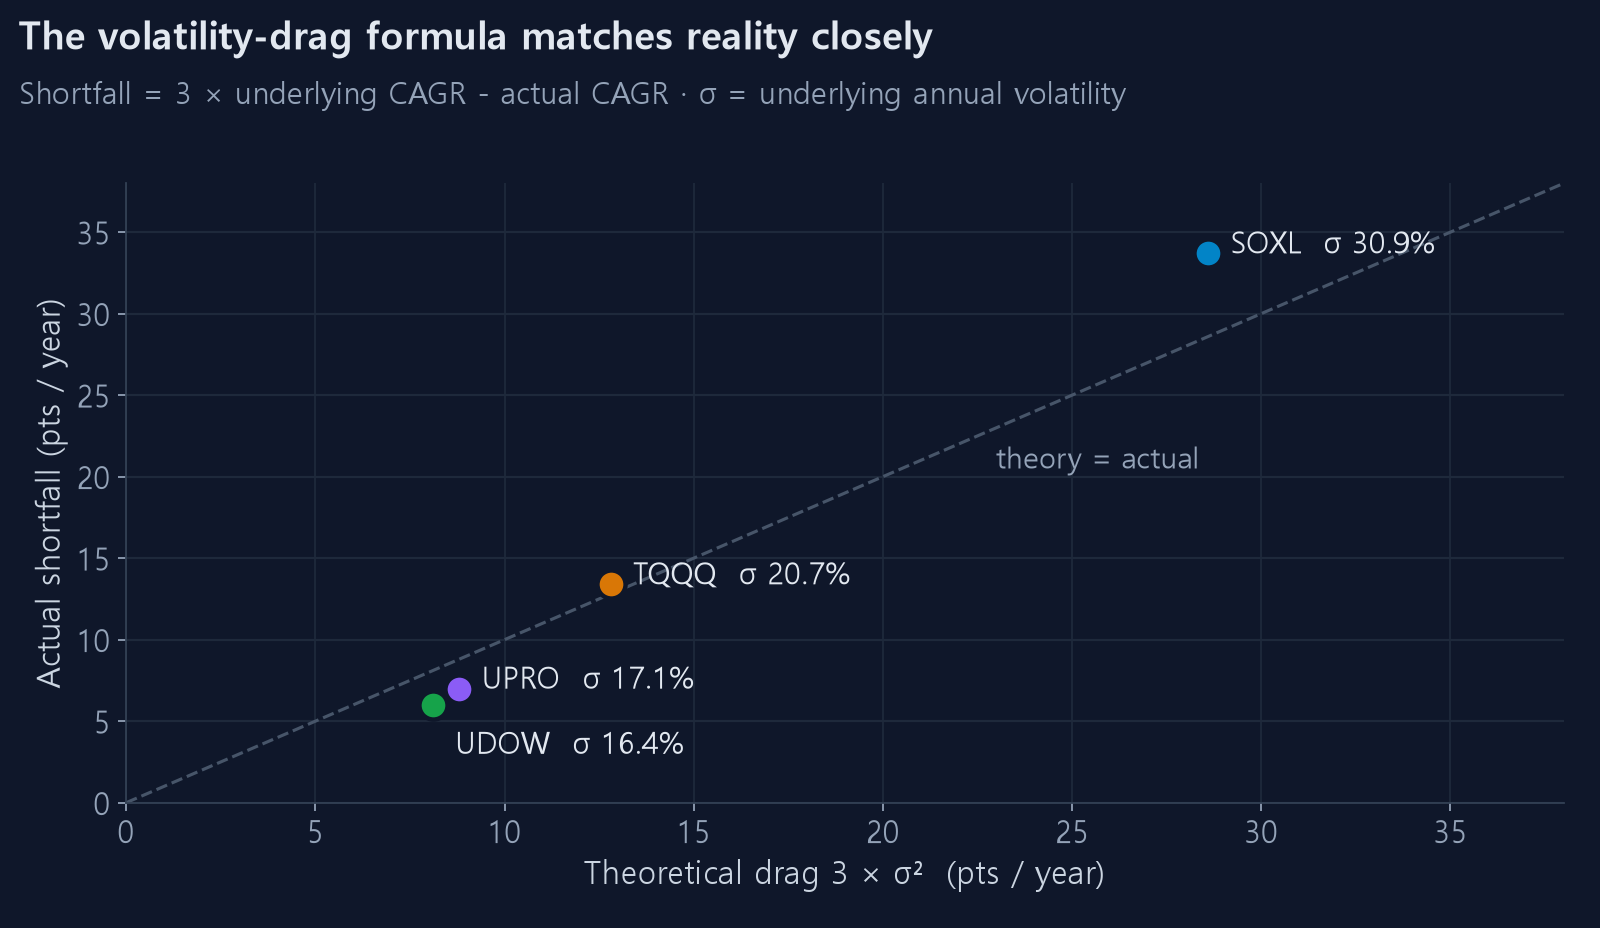
1. Run the 3x and the 1x side by side. Backtest SOXL (semiconductors 3x) and SOXX (semiconductors) over the same window and compare the buy-and-hold figures. Stretches where 3x delivers exactly 3x are rare.
2. Pick a choppy period. Something like 2015–2016 or 2018, where price wandered and returned to roughly where it started. The drag stands out.
3. Then pick a trending period. Over 2023–2024 the 3x product will have beaten 3x.
What to do with this
Long holds get worse as leverage rises. The longer the market chops sideways, the more drag accumulates. A plan to hold a 4x product for several years needs to start with this arithmetic.
Short holding periods fit the structure. The split-buying approach this site covers sells each tranche at its own target and cuts stale positions with a time limit. The point is to avoid long exposure to drag.
Always read the drawdown alongside the return. Drag does not only eat returns, it deepens declines. Why maximum drawdown matters more than returns explains why raising leverage casually is dangerous.
And if the leveraged product is an ETN, issuer credit risk sits on top of all this. Worth asking whether you need both.