These are the two tickers newcomers to leveraged ETFs compare most often. Both are 3x, both are tech-heavy, and they look interchangeable. Sixteen years of data says they behave quite differently.
What they track
TQQQ delivers three times the daily return of the Nasdaq 100 — about 100 large tech names including Apple, Microsoft and Nvidia, spread across software, semiconductors and consumer. Listed February 2010.
SOXL delivers three times the daily return of a US semiconductor index — roughly 30 companies including Nvidia, AMD and Broadcom. Listed March 2010.
The key difference is concentration. The Nasdaq 100 mixes several industries. The semiconductor index is one industry. When the industry breaks, there is nothing to diversify into.
First, a surprising fact
Annualised returns over each product's full history:
| Underlying CAGR | If 3x | Actual CAGR | |
|---|---|---|---|
| SOXL / SOXX | 23.2% | 69.5% | 35.8% |
| TQQQ / QQQ | 18.3% | 54.9% | 41.5% |
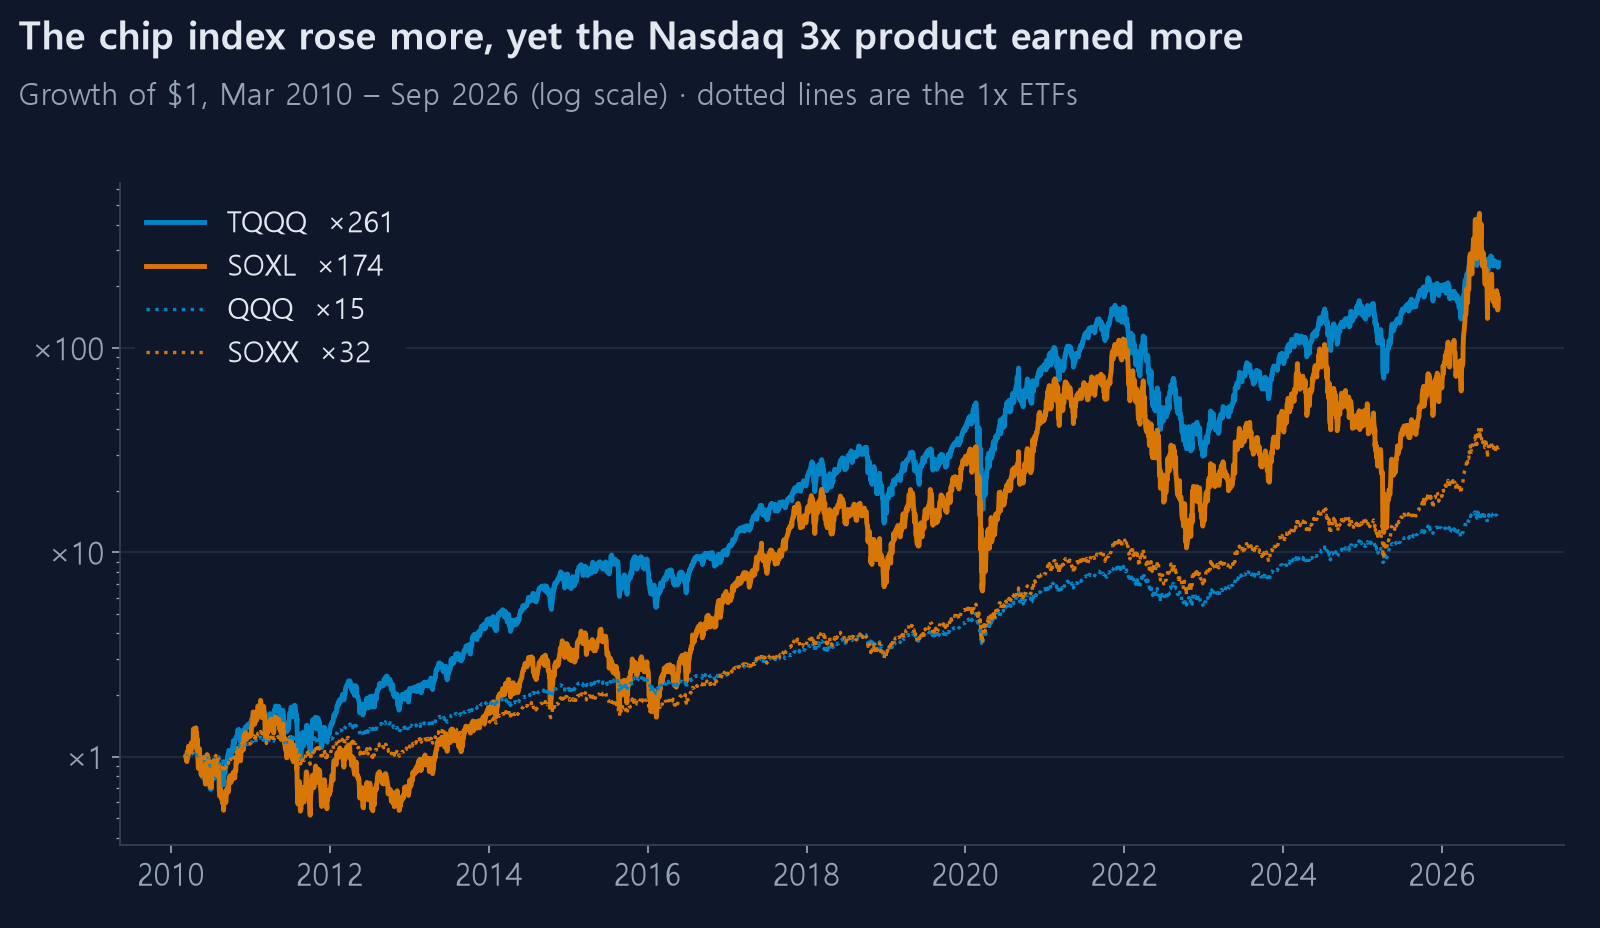
The semiconductor index beat the Nasdaq, yet the Nasdaq's 3x product beat the semiconductor 3x.
SOXX outperformed QQQ by 4.9 percentage points a year, and SOXL still trailed TQQQ by 5.7 points. That is a swing of more than ten points.
Why — volatility drag
Volatility is the culprit.
| Underlying volatility | Theoretical drag | Actual shortfall | |
|---|---|---|---|
| SOXX | 30.9% | 28.6pp | 33.7pp |
| QQQ | 20.7% | 12.8pp | 13.4pp |
Long-run drag is approximated by 3 × σ². Volatility enters squared. SOXX is 1.49x
as volatile as QQQ but pays 2.2x the drag.
Semiconductors went up more, but swung so much harder that the extra gain was handed straight back. Full detail in how many times leveraged were 3x ETFs, really.
SOXL's drawdowns are clearly deeper
Average maximum drawdown on a yearly-reset basis:
| Avg MDD | Worst year | Losing years | |
|---|---|---|---|
| SOXL buy and hold | −56.4% | −89.9% | 6 of 17 |
| TQQQ buy and hold | −39.7% | −80.2% | 3 of 17 |
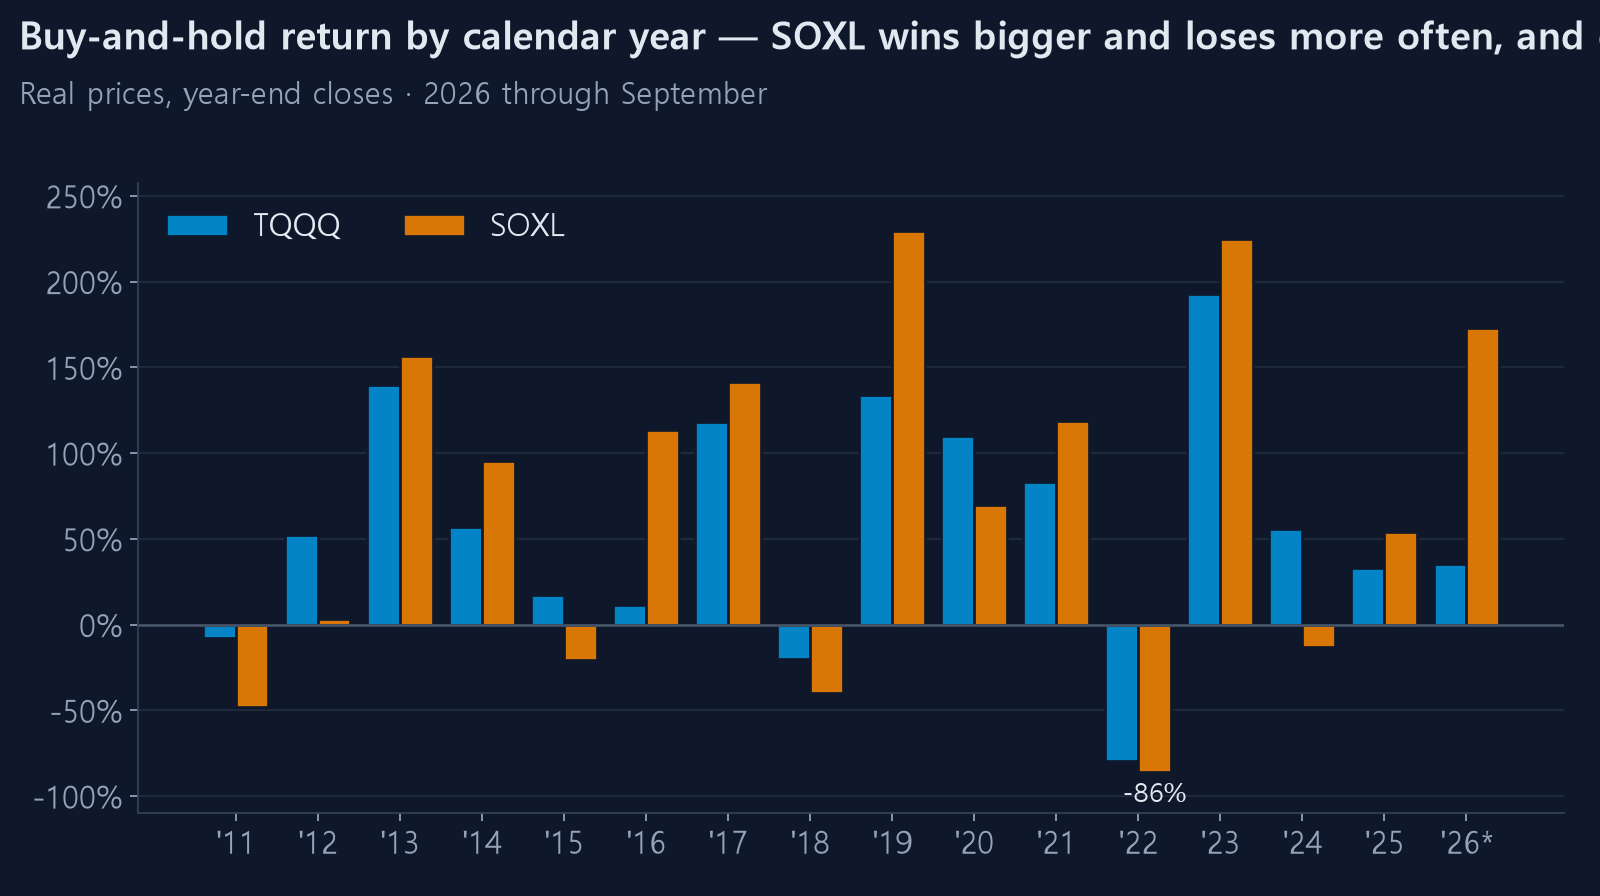
SOXL's worst year is −89.9%. $10,000 becomes $1,010, and recovering the original requires an 890% gain.
Twice as many losing years, too. When the chip inventory cycle turns, the whole industry falls together, and 3x multiplies the gap.
Add a split-buying strategy and the order flips back
A2 Standard (six tranches, 1.5% target, 10-session time cut) on the same settings:
| Strategy return | Strategy MDD | Losing years | Efficiency | |
|---|---|---|---|---|
| SOXL | 35.5% | −23.0% | 1 | 1.54 |
| TQQQ | 21.3% | −16.8% | 1 | 1.27 |
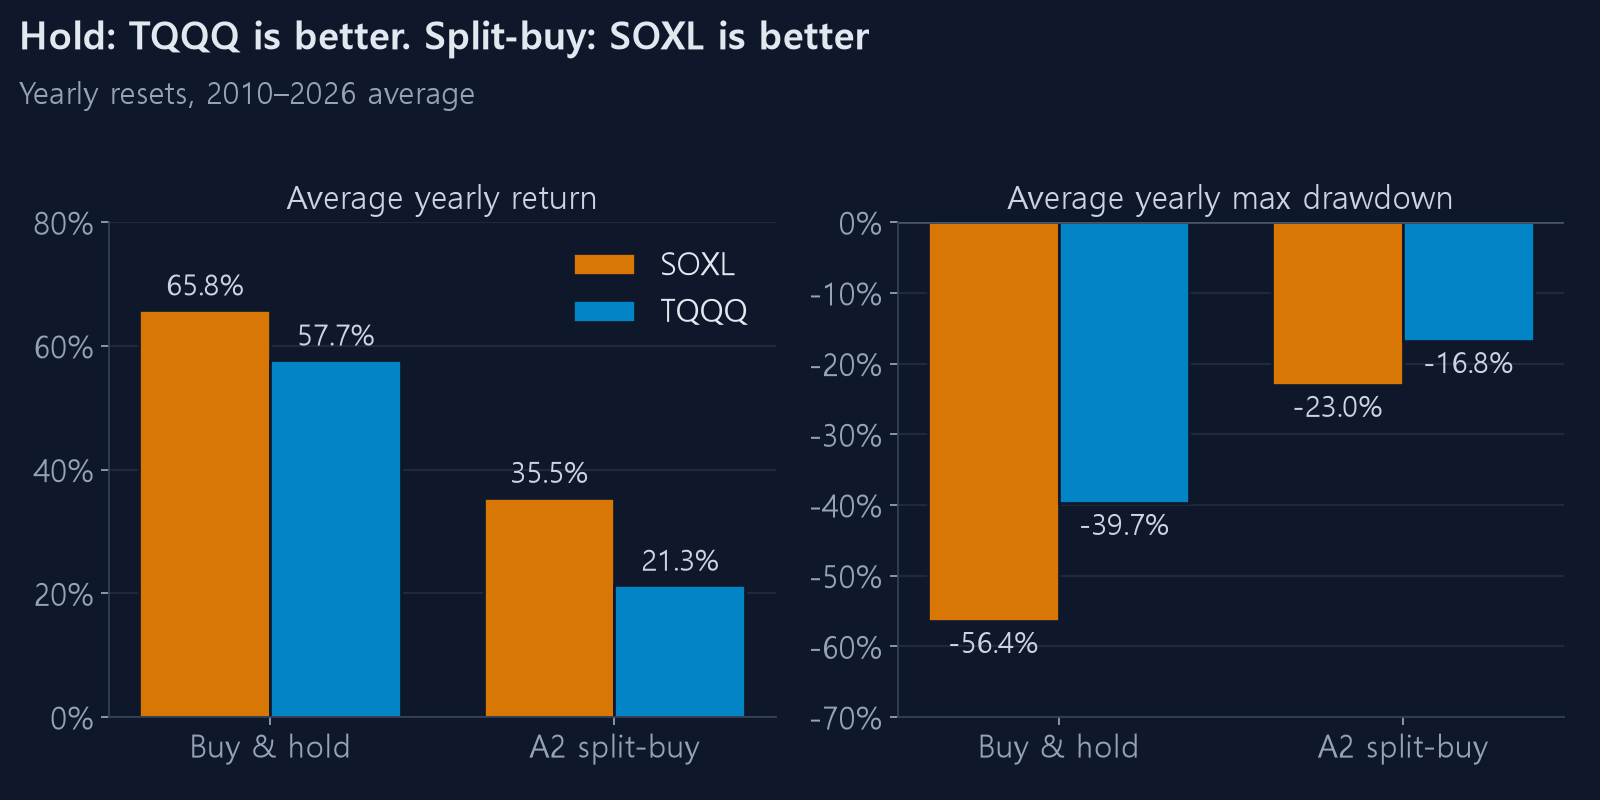
SOXL wins on both return and efficiency here.
Split buying buys dips and sells small bounces, so the more the price swings the more opportunities it gets. The volatility that poisoned buy and hold becomes the fuel.
The drawdown reduction is larger too: SOXL goes from −56.4% to −23.0%, a 33.4pp improvement, against TQQQ's 22.9pp.
More trading means more cost
Re-run with the fee raised from 0.1% to 0.3% each way. The busier strategy loses more. SOXL trades roughly 1,900 times over sixteen years; 0.6% round trip on each is a large number.
If your broker charges more, or you pay FX costs, this alone can flip the comparison. Enter your real cost and run it again.
Neither survives a decline that never recovers
Split buying buys weakness. If weakness simply continues, it accumulates inventory. Once every tranche is filled and the price keeps falling, there is no cash left to act.
The concentrated ticker is more exposed to that. When the chip cycle turns, it can grind down for a year or two. The Nasdaq at least has other sectors to lean on.
Choosing
On the numbers alone:
- Buy and hold → TQQQ. Higher return, much shallower drawdown
- Split buying → SOXL. Its volatility is what the strategy feeds on
- Drawdown above all → TQQQ with split buying (−16.8%)
But the decision order should not be the numbers. It should be this:
Convert the drawdown into money, then decide whether you can live with that amount.
−56% on $10,000 is −$5,600. The real question is whether you can spend several months with that gone from the account. If you cannot, and you break the rule, none of the numbers above are yours.
If both feel like too much
Validate on the unleveraged version first. Running the same strategy on SOXX (1x) or QQQ cuts the drawdown by more than half. Confirm the strategy works on the ticker before adding leverage — that order is much safer.
The Compare 30Y feature puts SOXL, TQQQ, SOXX and QQQ side by side year by year, and you can export the result as CSV or an image.
Either way, check it against the pre-live checklist before you start.