Note — strategy names such as S2 in this article are from the time of the research and are no longer in the site's strategy list (A, D, B, G and I families). See the strategy guide for the current ones.
"Rising rates hurt growth stocks" is repeated so automatically that it ought to follow that you could forecast semiconductor prices from Treasury yields.
This site holds US Treasury yields back to 1990 and SOXL daily bars back to 2010, so we measured it. The short answer is that you cannot use it to predict anything. The numbers we found along the way are the interesting part.
What was measured, and how
- Yields — US Treasury constant maturity from FRED: 10-year (DGS10), 30-year (DGS30), 2-year (DGS2)
- Price — SOXL daily closes, 2010-03 to 2026-09, 4,153 sessions
- Correlation — Pearson correlation between the change in yield (pp) and the return (%)
Comparing levels instead would be a mistake. Regressing log price on the yield level gives R² of 0.118 for the 10-year, 0.430 for the 2-year and 0.550 for the 2s10s spread — all spurious, because both series trend over time. Overlay any two rising lines and you get a high correlation.
1. Shifting the lead and lag
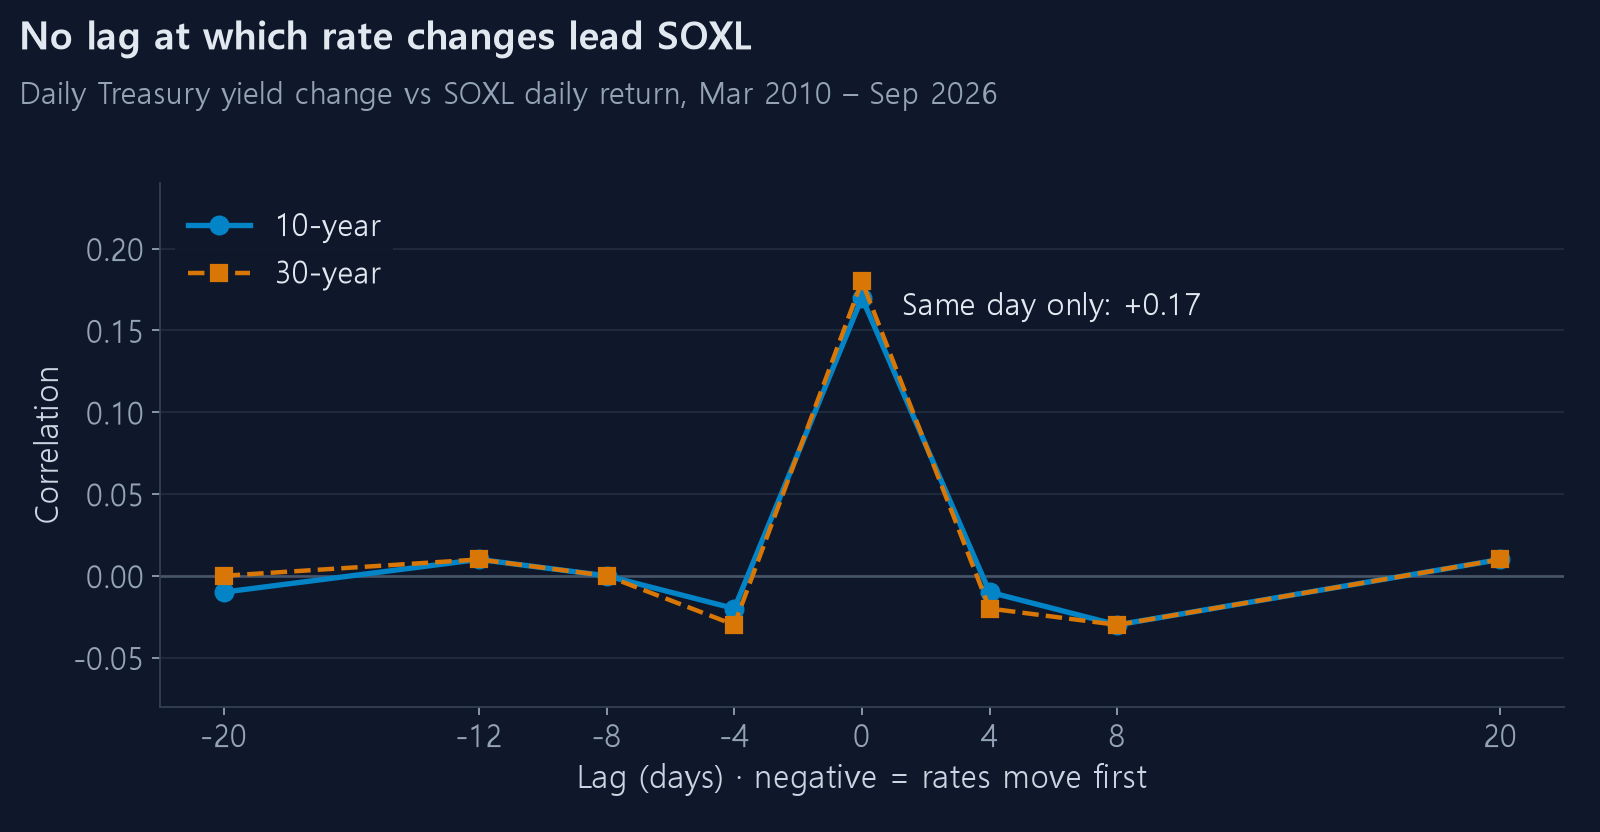
To see whether yields lead prices you have to shift them. A negative offset means
"the yield moved first and the price followed", which is what you would need for a
forecast.
10-year, daily returns
| offset | −20 | −12 | −8 | −4 | 0 (same day) | +4 | +8 | +20 |
|---|---|---|---|---|---|---|---|---|
| corr | −0.01 | +0.01 | −0.00 | −0.02 | +0.17 | −0.01 | −0.03 | +0.01 |
30-year, daily returns
| offset | −20 | −12 | −8 | −4 | 0 (same day) | +4 | +8 | +20 |
|---|---|---|---|---|---|---|---|---|
| corr | −0.00 | +0.01 | −0.00 | −0.03 | +0.18 | −0.02 | −0.03 | +0.01 |
Every shifted offset is zero. The only non-zero value is offset 0 — the same day.
Aggregating to weekly (5-session) and monthly (21-session) windows changes nothing. The maximum always lands at offset 0. Only in the monthly window does a weak +0.05 to +0.10 band survive across −4 to +12, and that looks less like leading than both series responding slowly to the same macro backdrop.
2. What the R² says
A same-day correlation of +0.17 sounds substantial. Squaring it tells a different story.
| Measure | corr | R² | Meaning |
|---|---|---|---|
| 10-year change | +0.166 | 0.028 | Explains 2.8% of SOXL's daily variance |
| 30-year change | +0.180 | 0.032 | Explains 3.2% |
Ninety-seven percent is something else. Knowing tomorrow's yield exactly would tell you almost nothing about tomorrow's SOXL.
3. A control group proves the method works
To check whether the number is small because the measurement is broken, run the same measurement on an asset that genuinely is driven by rates.
| Ticker | corr | R² | Move per +1pp in yield |
|---|---|---|---|
| TMF 3x long Treasuries | −0.903 | 0.816 | −47.0% |
| IWM small caps | +0.256 | 0.066 | +6.7% |
| SOXX semiconductors | +0.235 | 0.055 | +8.6% |
| QQQ Nasdaq 100 | +0.215 | 0.046 | +6.3% |
| SCHD dividend | +0.192 | 0.037 | +3.6% |
| SPY S&P 500 | +0.180 | 0.032 | +3.6% |
| SOXL 3x semis | +0.166 | 0.028 | +18.0% |
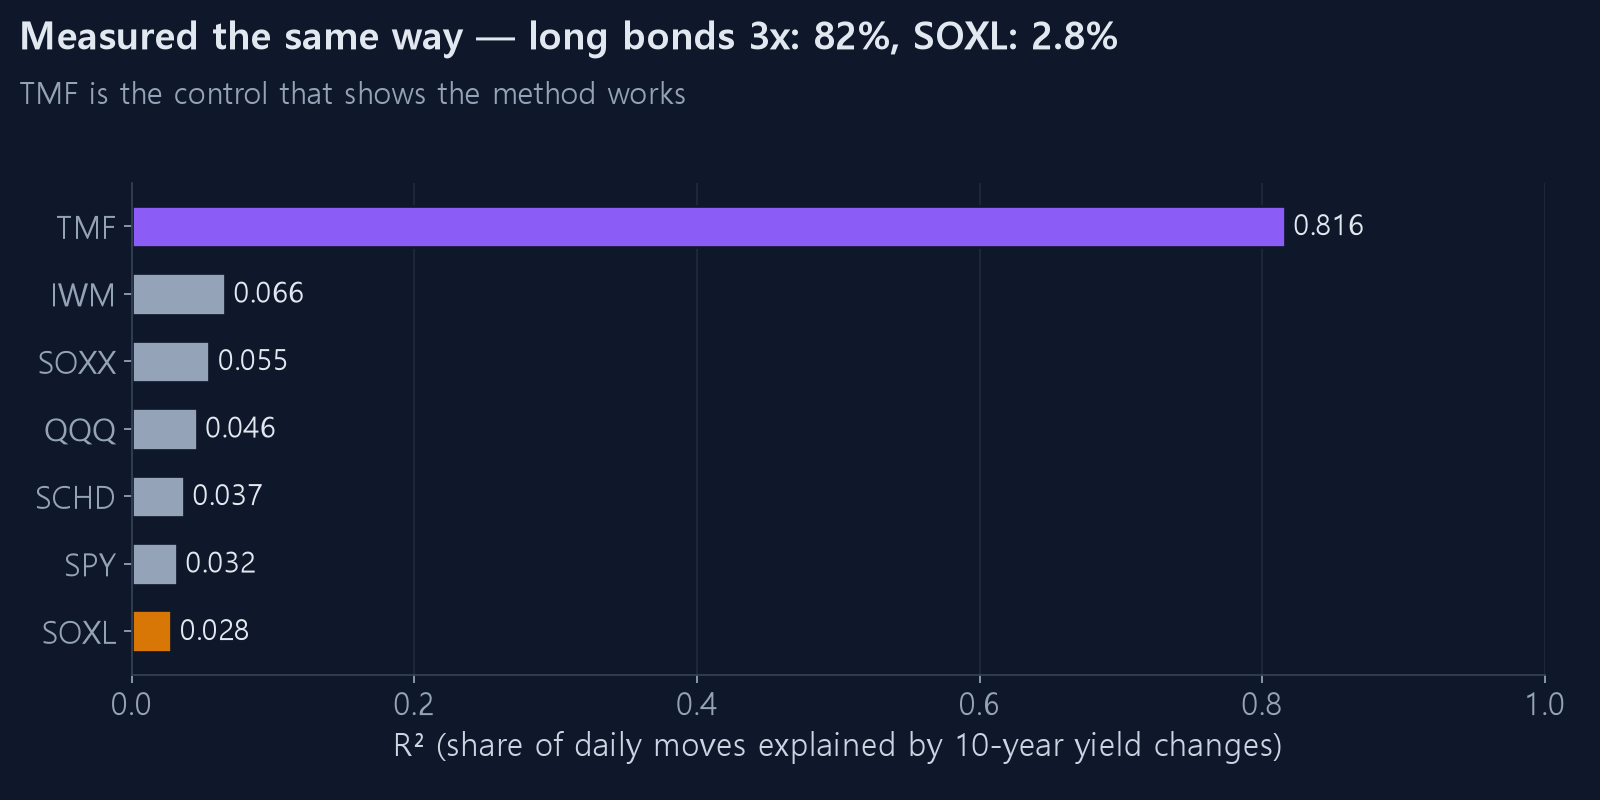
TMF comes in at R² 0.816. Eighty-two percent of a 3x long-bond product's movement is explained by the 10-year yield alone. The measurement is fine.
The same ruler gives SOXL 0.028. Semiconductors are not a rate-driven asset.
Note the signs, too. Only TMF is negative; every equity is positive. On days yields rose, stocks rose. That is the opposite of the standard claim.
4. Large yield moves make it even clearer
Isolating days when the 10-year moved sharply:
| That day's yield change | Sessions | SOXL mean | Median | % up |
|---|---|---|---|---|
| Fell more than 0.10pp | 131 | −3.27% | −3.45% | 34.4% |
| −0.10 to −0.05 | 469 | −1.58% | −1.55% | 38.0% |
| Barely moved | 2,940 | +0.54% | +0.62% | 56.0% |
| +0.05 to +0.10 | 468 | +1.40% | +1.34% | 60.0% |
| Rose more than 0.10pp | 145 | +0.80% | +0.97% | 55.9% |
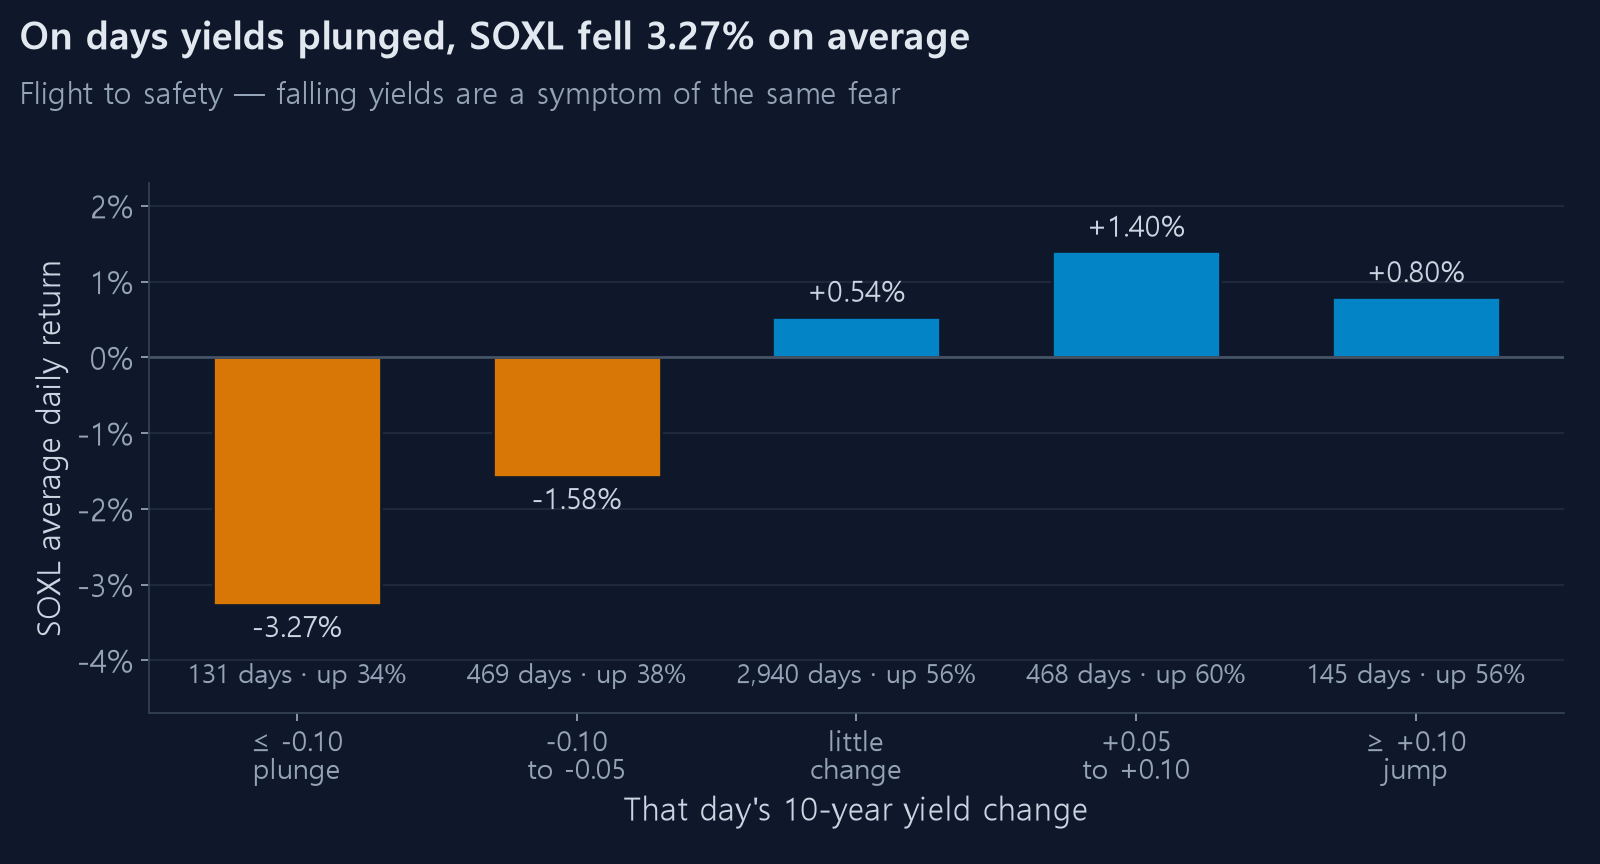
On days the yield collapsed, SOXL fell 3.27% on average. The exact opposite of the intuition.
The explanation is not difficult. A day when the 10-year drops more than 0.10pp is usually a day when bad news sent money running into Treasuries. Flight to safety bids bonds up (yields down) and sells risk. The falling yield is not the cause; it is the same fear wearing a different face.
Conversely, sharp yield increases mostly came on strong economic data, and stocks rose those days.
5. But the sign flipped in 2021
This is the most important section. Computing the correlation year by year:
| Year | 10-year | Year | 10-year | |
|---|---|---|---|---|
| 2011 | +0.52 | 2019 | +0.45 | |
| 2012 | +0.48 | 2020 | +0.36 | |
| 2013 | +0.19 | 2021 | −0.05 | |
| 2014 | +0.40 | 2022 | −0.11 | |
| 2015 | +0.26 | 2023 | −0.11 | |
| 2016 | +0.29 | 2024 | +0.05 | |
| 2017 | +0.25 | 2025 | +0.18 | |
| 2018 | +0.29 | 2026 | −0.27 |
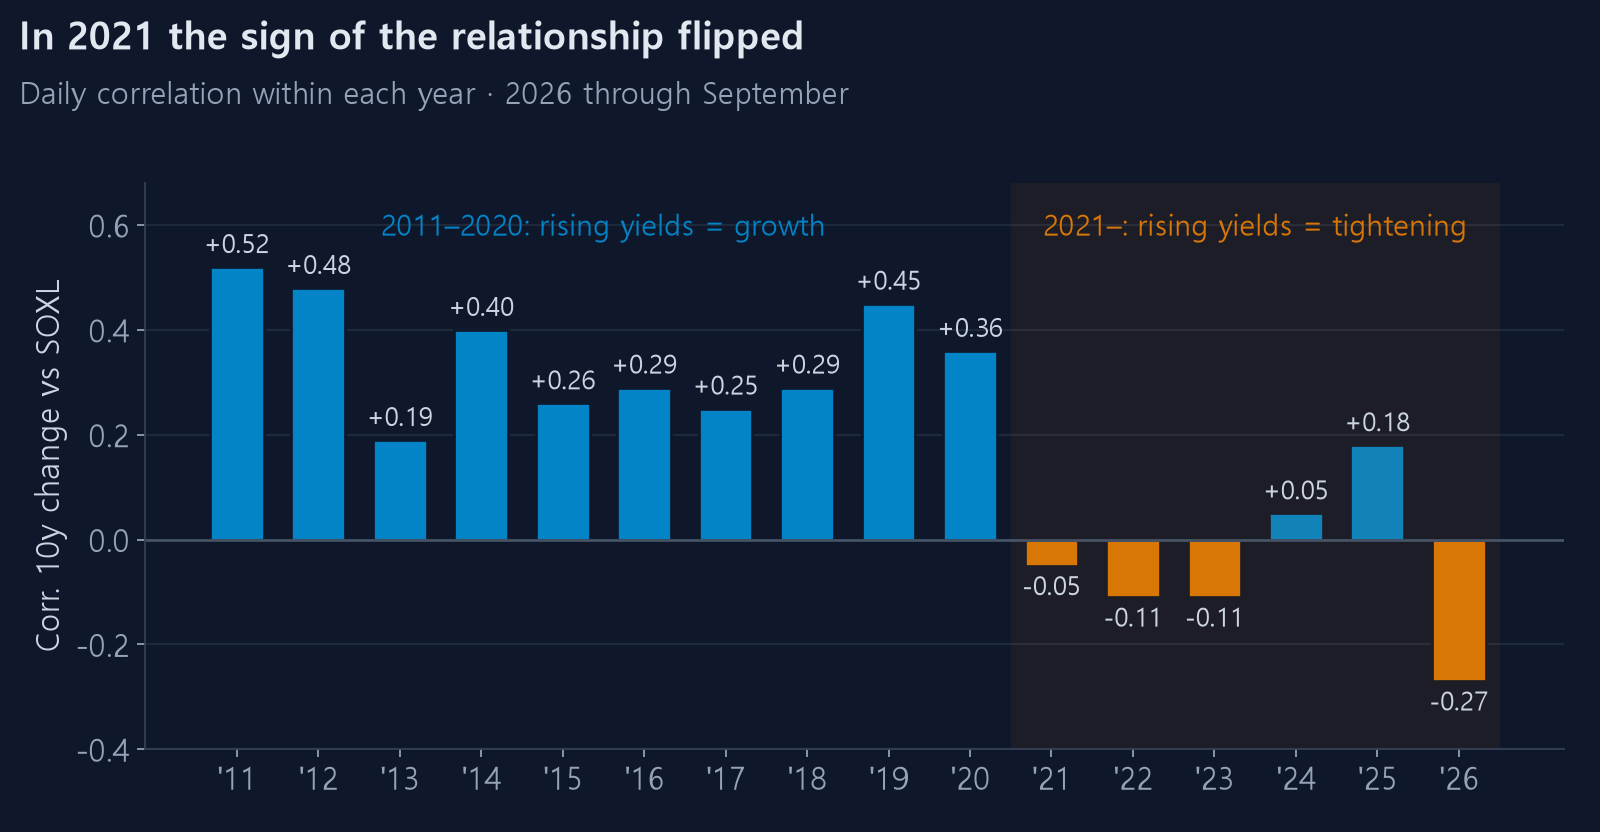
Every year from 2011 to 2020 is positive, averaging around +0.35. From 2021 the sign turns negative.
What changed was the reason yields were rising.
- The 2010s — a low-inflation world. Rising yields signalled a strengthening economy, and stocks rose with them. Hence positive correlation
- Since 2021 — an inflation world. Rising yields signalled the Fed tightening harder, and stocks fell. Hence negative correlation
The same indicator carries the opposite meaning depending on the era. So "rising rates hurt stocks" is half right: true for the last five years, false for the ten before that.
This is also the decisive argument against putting rates into a trading rule. It is not merely that a relationship learned from history might not persist — this one actually inverted, recently.
6. Was 2022 really about rates?
It looks like the strongest counterexample. We checked.
| Year | 10-year | SOXL | That year's daily corr |
|---|---|---|---|
| 2022 | 1.63% → 3.88% (+2.25pp) | −87% | −0.109 |
| 2023 | 3.79% → 3.88% (+0.09pp) | +235% | −0.107 |
| 2024 | 3.95% → 4.58% (+0.63pp) | −3% | +0.052 |
Looking only at 2022 — yields surged, price collapsed — it reads like causation. But:
- That year's daily correlation was only −0.109. Day to day they moved almost independently
- In 2023 the yield barely moved (+0.09pp) and SOXL rose 235%. If rates were the driver, that year should have gone nowhere
- In 2024 the yield rose 0.63pp and SOXL was flat at −3%
Both things did happen in 2022. But happening at the same time is not one causing the other. The larger driver of the 2022 semiconductor decline was the inventory correction after the pandemic demand pull-forward.
7. We put it in a strategy anyway
A weak relationship is not necessarily a useless one, so we tested it: switch strategies based on whether yields are rising, flat or falling over the prior 126 sessions (about six months), with a ±0.25pp threshold.
| CAGR | Max drawdown | Calmar | |
|---|---|---|---|
| 10-year, best-in-hindsight (curve fitted) | 70.7% | −31.7% | 2.23 |
| 10-year, walk-forward | 62.4% | −33.9% | 1.84 |
| 30-year, best-in-hindsight (curve fitted) | 59.4% | −28.0% | 2.12 |
| 30-year, walk-forward | 50.6% | −43.6% | 1.16 |
| Policy rate + 10-year combined, walk-forward | 66.7% | −33.9% | 1.96 |
| Do nothing, hold S2 | 65.1% | −42.9% | 1.52 |
Switching on the 10-year did worse than simply running one strategy the whole time (62.4% against 65.1%).
The 30-year was far worse at 50.6%. Because a yield moves continuously rather than in steps, the regime flipped 49 times, and the switching cost was all that remained.
And the 8-point gap between best-in-hindsight (70.7%) and walk-forward (62.4%) is pure curve fitting. The former picked "this strategy for this regime" after seeing every outcome; the latter picked using only data available at the time. Skip that check and you will believe in an edge that does not exist. The method is in what to check first when a backtest looks good.
Summary
- Treasury yields do not lead semiconductor prices. No signal at any offset from −20 to +20 sessions; the only relationship is +0.17 on the same day
- R² 0.028. It explains 2.8% of daily variance. The same ruler gives TMF 0.816
- The sign is positive. SOXL rose on days yields rose. Days of sharp yield declines were the worst, averaging −3.27%
- The sign inverted in 2021, because the reason yields move changed
- Adding it to a strategy made things worse. Under walk-forward, doing nothing won
So why draw the rate on the chart at all? For context, not prediction. Seeing how your equity curve held up through the high-rate stretch of 2022–2024 is genuinely useful. The backtest page plots the policy rate on the right axis and shades the tightening cycles.
Watching an indicator and trading on it are different things. The numbers here show the size of that difference.
The same analysis on the federal funds rate is in do rising rates really hurt semiconductors.