The US market closes in the early morning, Korean time, and Seoul opens a few hours later. That makes the following idea feel obvious:
If KORU, the 3x South Korea ETF, rallied hard overnight in New York, the Korean market should rise in the morning. So buy at the open, take a small profit if it comes, otherwise sell at the close.
I tested it. The short answer: it did not work in any of the 13 years. Following the reason why led to a different result in the opposite direction.
Test setup
| Item | Rule |
|---|---|
| Signal | KORU closes up X% or more on US day D |
| Entry | Buy at the open of the first Korean session dated after D |
| Exit | If the intraday high reaches open × (1 + take-profit), sell there; otherwise sell at that day's close |
| Costs | 0.1% commission on each buy and sell. Single stocks also pay 0.20% Korean transaction tax on the sell |
| Accounting | Restart from 1.0 every January 1, compound within the year, mark open positions at the Dec 31 close |
| Period | 2014 to 2026-09-18 (first full year after KORU's April 2013 listing), Yahoo Finance daily bars |
| Instruments | KODEX Leverage (122630), KODEX 200 (069500), SK hynix, Samsung Electronics |
When a Korean holiday makes several US sessions map to the same Korean session, only the latest signal is used, so no signal is traded twice.
1. Result: all 64 combinations lost money
Four triggers (2, 3, 4, 6%) × four take-profits (0.5, 1, 2%, none) × four instruments gives 64 combinations. Zero had a positive CAGR.
| Setting (KODEX Leverage) | CAGR | Max drawdown | Trades | Win rate | Up years |
|---|---|---|---|---|---|
| Best: KORU ≥6%, 1% take-profit | −1.6% | −34.4% | 235 | 65% | 4 / 13 |
| Typical: KORU ≥3%, 1% take-profit | −8.0% | −73.3% | 712 | 58% | 2 / 13 |
A 58–65% win rate and still a loss. The 1% target is hit often, but the misses slide further into the close, and every round trip pays 0.2%. It is a textbook case of a high win rate hiding a losing system.
Year by year, typical setting
| Year | Strategy | Max drawdown that year | Holding KODEX Leverage |
|---|---|---|---|
| 2014 | −10.6% | −10.6% | −17.6% |
| 2015 | −7.1% | −9.3% | −3.9% |
| 2016 | −17.0% | −19.4% | +15.9% |
| 2017 | −2.9% | −6.8% | +55.3% |
| 2018 | −21.7% | −23.0% | −35.5% |
| 2019 | +4.9% | −3.0% | +24.3% |
| 2020 | −11.4% | −19.4% | +63.3% |
| 2021 | −10.6% | −17.6% | +1.1% |
| 2022 | −16.8% | −17.2% | −46.7% |
| 2023 | −4.1% | −11.9% | +45.0% |
| 2024 | −17.0% | −19.9% | −24.6% |
| 2025 | −5.4% | −15.0% | +246.3% |
| 2026* | +23.7% | −9.8% | +127.6% |
*2026 runs to September 18.
Even in 2025, when the ETF gained 246%, the strategy lost money.
2. Where did the gain go? Into the opening gap
It is true that Korea tends to rise after a strong night for KORU. The question is when it rises.
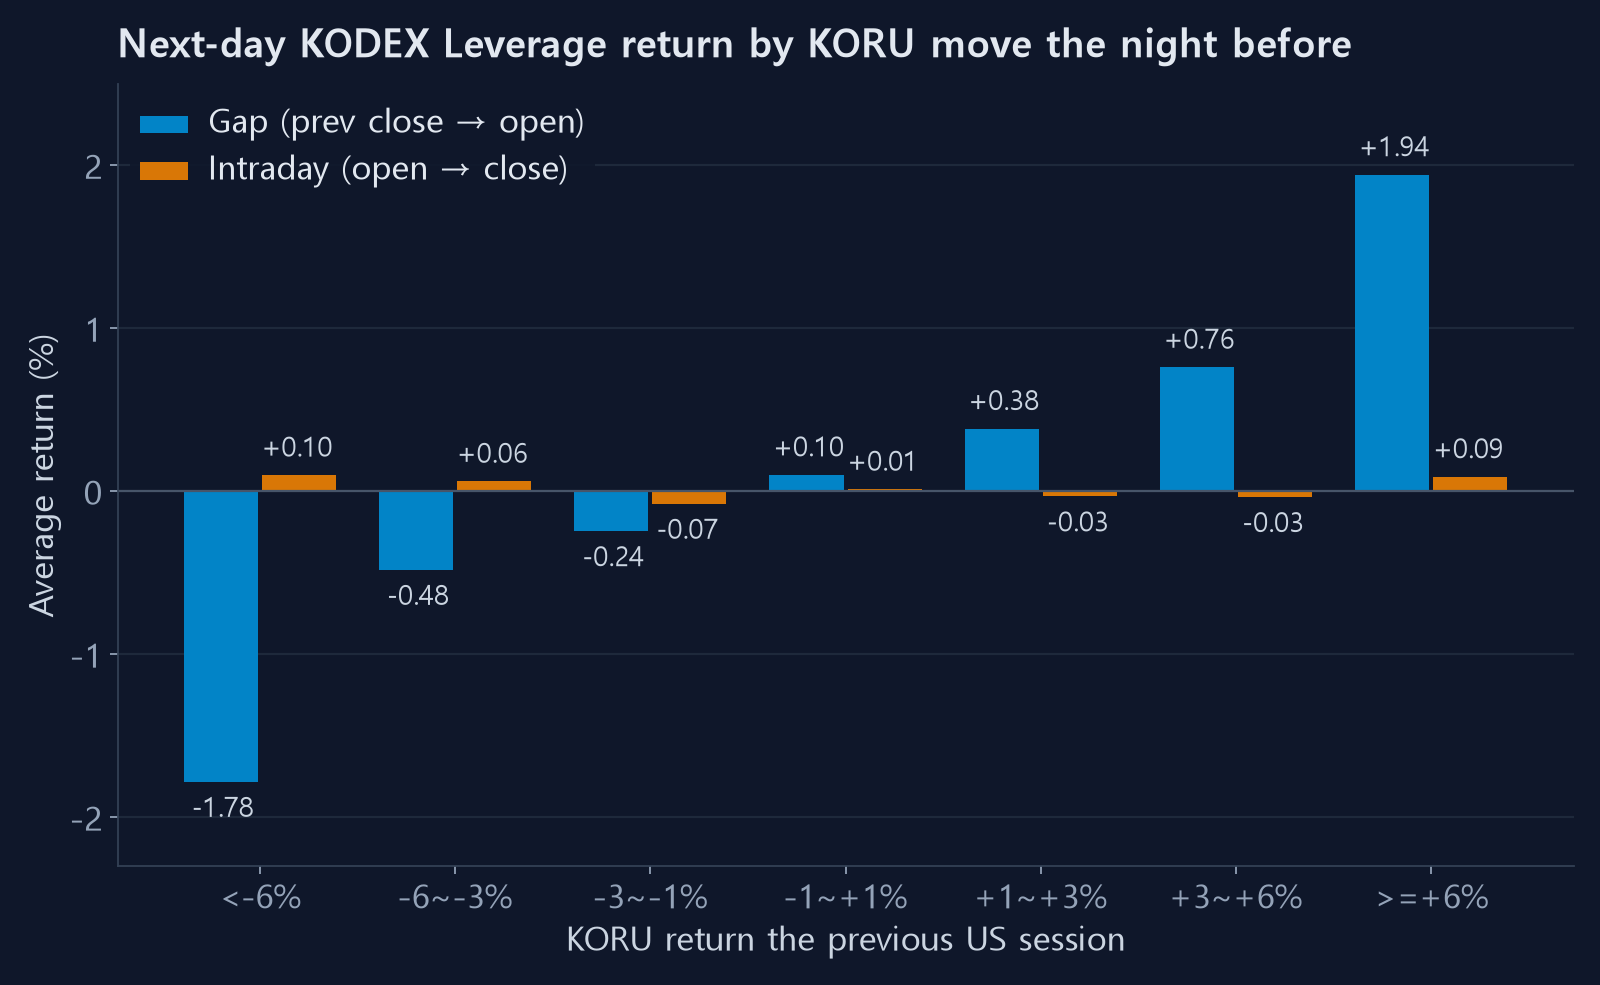
| KORU the night before | Days | Gap (prev close → open) | Intraday (open → close) |
|---|---|---|---|
| below −6% | 242 | −1.78% | +0.10% |
| −6 to −3% | 453 | −0.48% | +0.06% |
| −3 to −1% | 523 | −0.24% | −0.07% |
| −1 to +1% | 645 | +0.10% | +0.01% |
| +1 to +3% | 555 | +0.38% | −0.03% |
| +3 to +6% | 505 | +0.76% | −0.03% |
| +6% or more | 242 | +1.94% | +0.09% |
The gap (blue) steps up with KORU. The intraday return (amber) sits near zero in every bucket.
After KORU gains more than 6%, KODEX Leverage opens 1.94% higher. From there it adds an average of 0.09% by the close. Buying at the open does not buy the move; it buys a price that already contains the move. Add 0.2% in round-trip costs and the expected return turns negative.
Korea's pre-open call auction prices in the overnight news. By the time a retail order reaches the open, the work is done.
3. Attempts to fix it (all failed)
① Only buy when the gap looks too small. If KORU jumped but the gap is modest, maybe the market has not caught up. Filtering to gaps at 0–75% of the expected size cut the losses but the best CAGR was still −0.8%. Under-reacting days did not catch up during the session.
② Same logic on semiconductors. Buy SK hynix at the open after the US chip ETF SOXX rallies. Best case SOXX ≥4% with 1% take-profit: CAGR −5.1%. SOXX ≥2% (1% take-profit): −19.7%. The transaction tax on single stocks made it worse.
③ Different profit targets. From 0.3% to 3%, and plain sell-at-close. None changed the sign. Tighter targets only raise the win rate.
4. If you knew the future: 77% a year
Flip the logic. If the gain lives in the gap, you must hold before the gap forms: buy at the Korean close, sell at the next open.
Assume you know in advance that KORU will rise at least 1% that night:
| CAGR | Max drawdown | Up years | |
|---|---|---|---|
| Hindsight: buy prior close → sell at open (KODEX Leverage) | +76.7% | −14.9% | 13 / 13 |
| Real strategy: KORU ≥3% → buy at open, 1% take-profit | −8.0% | −73.3% | 2 / 13 |
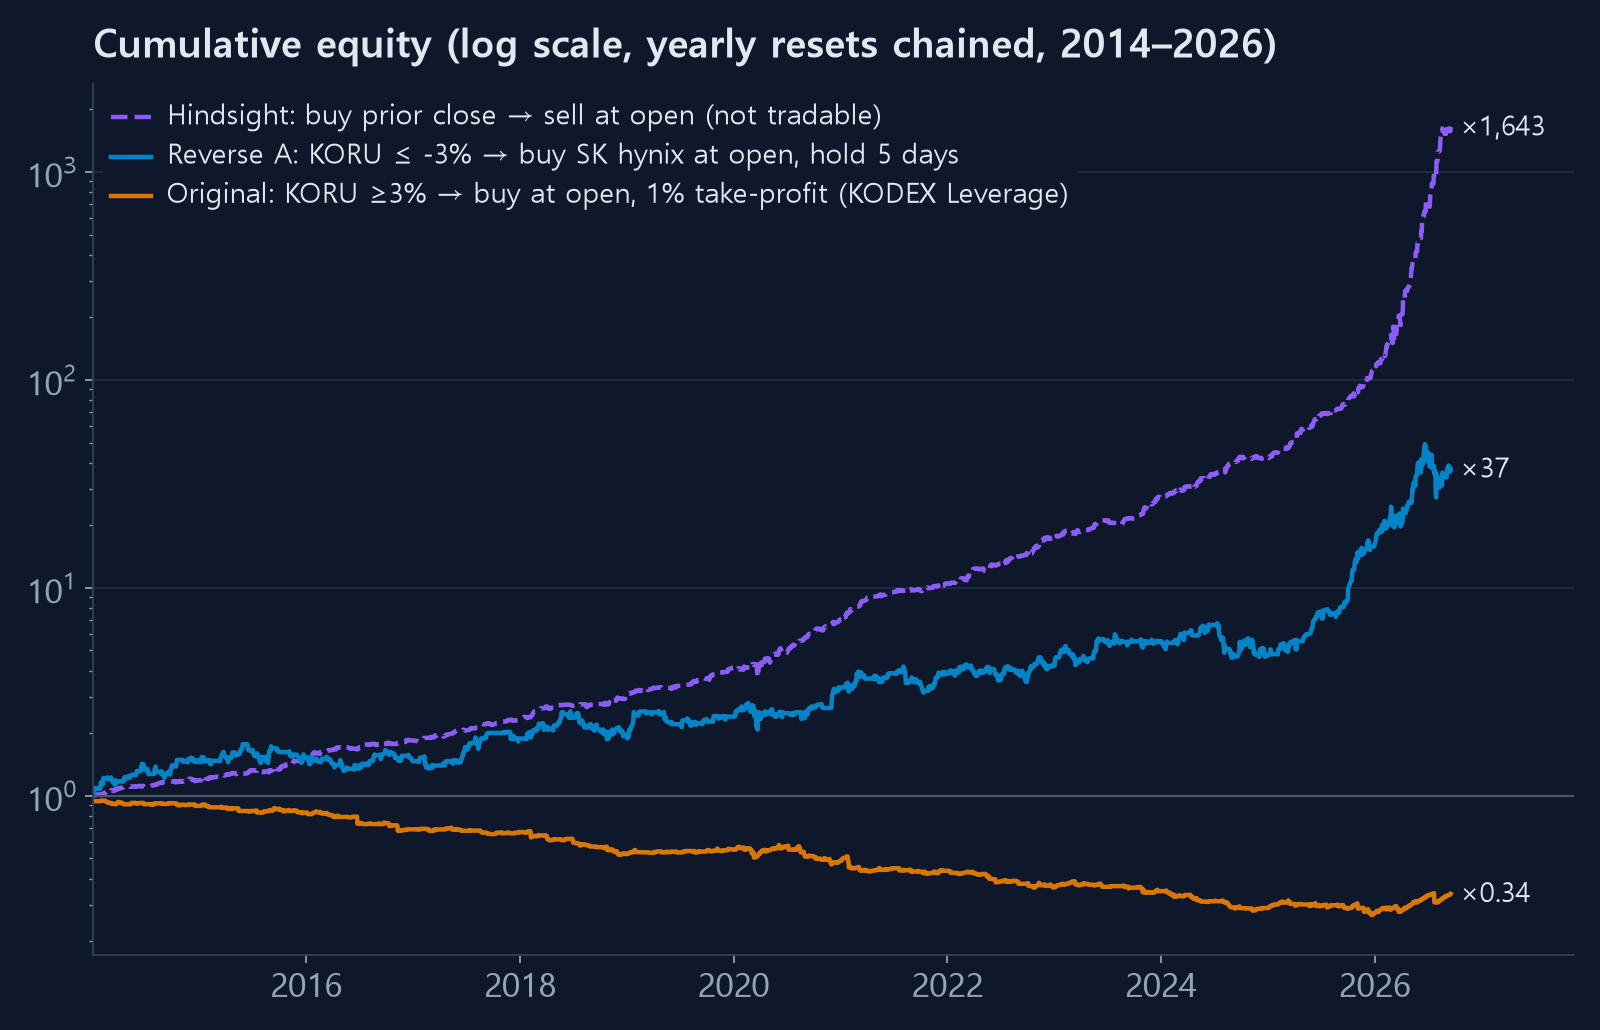
The profit is real. But at the 15:30 Korean close, nobody knows what New York will do that night. The whole edge is a matter of information timing, and a retail trader is on the wrong side of it.
I also ran a tradable version that buys at the close when S&P 500 futures at 15:00 KST are up. Over the two years of hourly data available, some thresholds were profitable. But that stretch was a bull market in which simply holding the index returned more than 100%, and moving the threshold from 0.2% to 0.5% flipped it to a loss. Two years is not enough to call it.
5. The reverse trade: buy the day after a crash
Look at the gap table again. After KORU falls hard, the gap is sharply negative, yet the session drifts slightly up (+0.10% in the below −6% bucket). That is the trace of an over-reaction being unwound. So I reversed the direction.
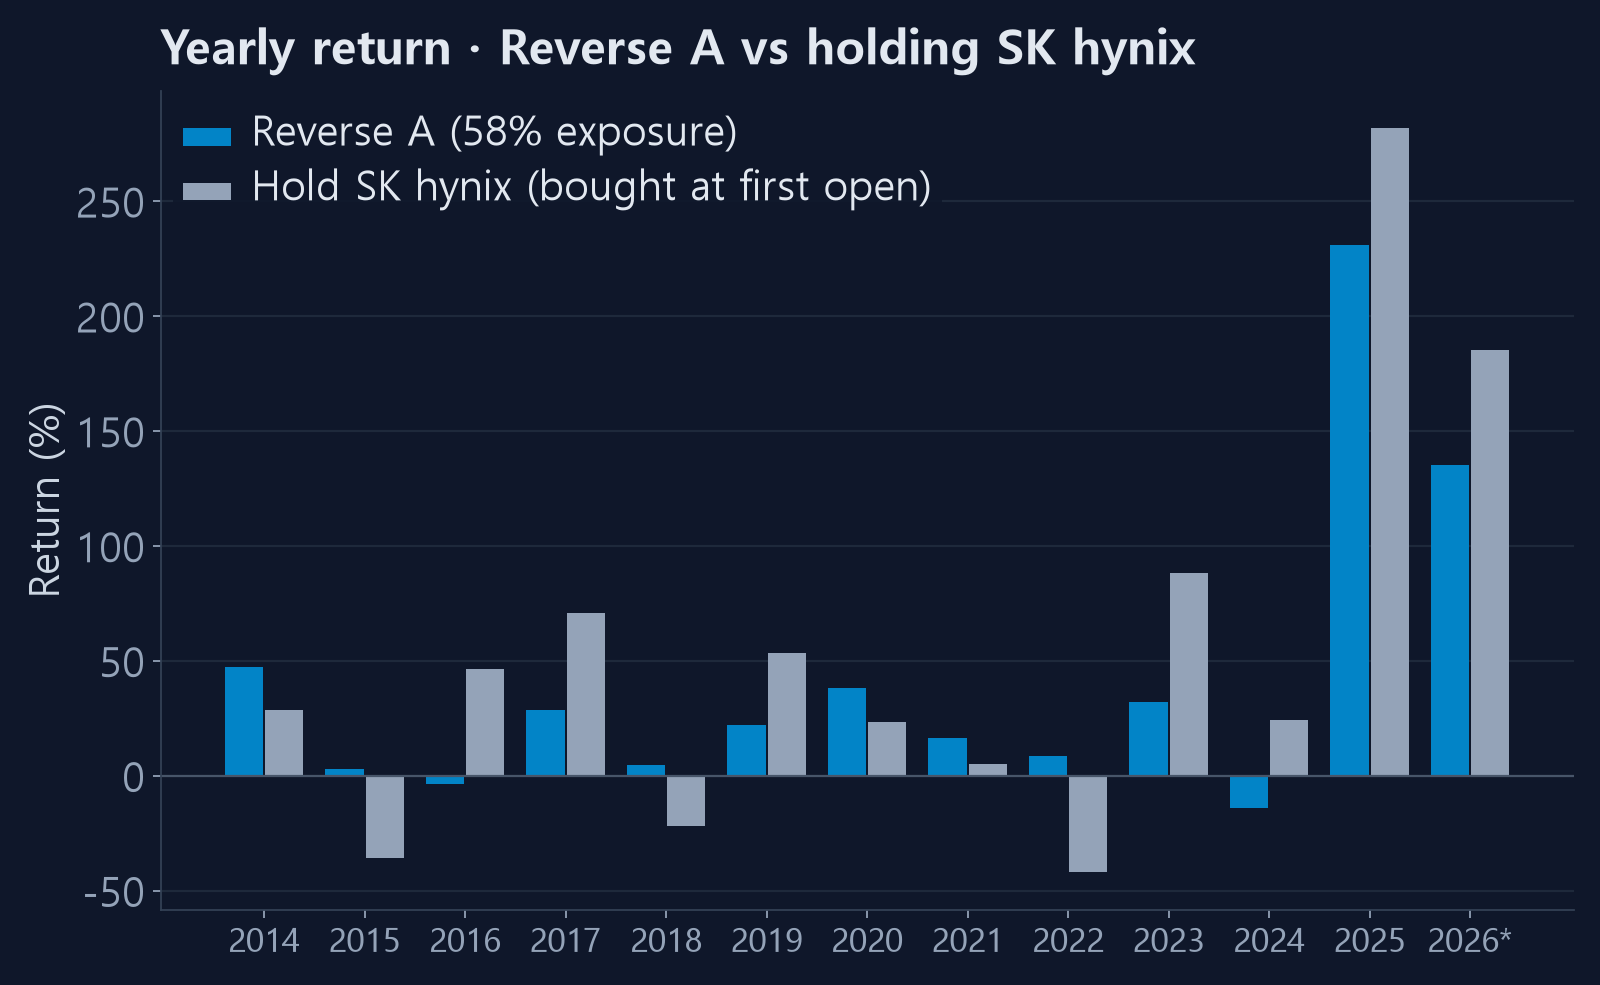
Reverse A: after KORU falls X% or more, buy the Korean instrument at the open and hold for N sessions.
64 combinations again (triggers −2, −3, −4, −6% × holds of 1, 3, 5, 10 days × four instruments):
- 45 combinations were profitable. The original direction had zero
- 25 were profitable in both halves, 2014–2019 and 2020–2026
By instrument (KORU ≤ −3%, hold 5 days)
| Instrument | CAGR | Max drawdown | 2014–19 | 2020–26 | Buy & hold CAGR | Buy & hold max DD |
|---|---|---|---|---|---|---|
| SK hynix | +32.1% | −44.6% | +15.7% | +47.9% | +34.6% | −54.7% |
| Samsung Elec. | +13.2% | −43.6% | +1.2% | +24.7% | +18.8% | — |
| KODEX Leverage | +12.1% | −61.1% | −3.1% | +27.1% | +18.1% | −68.4% |
On SK hynix: 363 trades, average +1.21% after costs, 58% winners, 11 of 13 years up.
Is the signal real?
SK hynix rose so much over this period that buying on any day might have worked. Two checks:
Random-entry control. 200 simulations buying on random dates at the same frequency as the signal, holding 5 days.
| Instrument | Reverse A | Random entry, median CAGR | Random, top 5% |
|---|---|---|---|
| SK hynix | +32.1% | +1.2% | +11.7% |
| KODEX Leverage | +12.1% | +1.6% | +10.1% |
For SK hynix the signal beats the random top 5% (+11.7%) by almost three times. Hard to call that luck. On KODEX Leverage it only just clears the top 5%.
Against buy and hold. To be fair: simply holding SK hynix returned more (34.6%). Reverse A made 32.1% while in the market only 58% of the time, and its max drawdown was −44.6%, 10 points shallower than holding (−54.7%). Pay interest on the idle 42% and the gap narrows further.
So reverse A is less "beats holding" and more "earns about the same while holding less."
Why to stay cautious
- It is one stock. Much of it is the post-2020 semiconductor cycle (15.7% in 2014–19 vs 47.9% in 2020–26)
- KODEX Leverage returned −3.1% a year in 2014–19. This is not a law of the Korean index
- The 2026 drawdown alone was −44.6%. A five-day hold carries a different kind of risk from a day trade
- This is the best of 64 combinations. Read walk-forward validation and parameter plateaus before trusting it. It is encouraging that triggers of −3 to −4% and holds of 3 to 10 days all rank near the top, which looks more like a plateau than a spike
6. A screening winner that vanished
There was a reverse B as well: after SOXX gains 2% or more, sell SK hynix at the open and buy it back at the close, betting on the gap fading. An early screen from 2001 with 0.2% costs showed +0.73% per trade and 22 of 26 up years, the best-looking idea in the batch.
With the conditions set properly, it disappeared:
| Condition | Average per trade | CAGR |
|---|---|---|
| Early screen (2001 onward, 0.2% costs) | +0.73% | — |
| Full backtest (2014 onward, 0.4% costs incl. tax) | +0.06% | +1.0% |
The recent period halved the pre-cost effect (0.93% → 0.46%), and the 0.2% transaction tax took almost all of the rest. Shorting a single Korean stock intraday is also impractical for most individuals.
Never trust a result before the costs are in, especially for high-turnover ideas.
Summary
- Buying Korea at the open after KORU rallies lost money in all 64 combinations over 13 years
- The reason is simple: the overnight move is fully priced into the opening gap, and the average intraday return after the open is about zero. Costs make that zero negative
- To capture the gap you must hold before it forms. With perfect foresight that is 77% a year, but the information does not exist at the Korean close
- The reverse direction, buying after a crash, showed a signal. On SK hynix it beat random entry by a wide margin, but did not beat simply holding, and it relies on one stock and one cycle
- The gap-fade idea that led the screen vanished once costs and period were corrected
"When the US rises, Korea rises" is true. Precisely because everyone knows it, the price has moved before our order arrives. The backtest puts a number on that gap.
Method notes: Korean opens are assumed to fill at the call-auction price; tick size and slippage would make real results slightly worse. Transaction tax is 0.20% (2026 KOSPI rate); ETFs are exempt. For the long-run behaviour of leveraged ETFs, see leverage decay, measured.