Note — strategy names such as S1–S4 and R1 in this article are from the time of the research and are no longer in the site's strategy list (A, D, B, G and I families). See the strategy guide for the current ones.
If you have run a SOXL dip-buying strategy for a while, you have probably had this idea:
SOXL has years where it loses badly. If I hold a small slice of something that makes money in exactly those years, I might give up a little return and get a much shallower drawdown.
So we went looking. We built a dedicated strategy for six tickers: inverse semiconductors (SOXS), financials (FAS), homebuilders (NAIL), inverse long Treasuries (TMV), defense (DFEN) and energy (ERX). Then we paired each with the site's then-current SOXL ladder strategy S2 Ensemble-3.
The first results looked perfect. When we fed in more history, every one of them fell apart. This is the record of how that happened, and a checklist for spotting the same trap in your own backtests.
1. 2016–2026: adding a partner seemed to cut the drawdown
We put 80% in SOXL S2 and 20% in the partner strategy, resetting the split every January. The fair comparison is the same 20% held as cash.
| Portfolio (2016–2026) | Avg yearly return | Avg yearly MDD | CAGR | Full-period MDD |
|---|---|---|---|---|
| S2 alone | 89.3% | −15.2% | 83.7% | −26.9% |
| S2 80% + cash 20% | 71.5% | −13.0% | 67.9% | −22.0% |
| S2 80% + SOXS 20% | 75.4% | −12.4% | 72.3% | −19.8% |
| S2 80% + FAS 20% | 80.4% | −13.0% | 75.6% | −21.2% |
| S2 80% + NAIL 20% | 81.2% | −13.0% | 76.2% | −21.7% |
| S2 8 : SOXS 2 : FAS 2 | 70.3% | −10.9% | 67.3% | −16.2% |
| S2 8 : cash 4 | 59.5% | −11.4% | 57.1% | −18.6% |
Average yearly return and MDD restart from the same capital every January. CAGR and full-period MDD chain those years together.
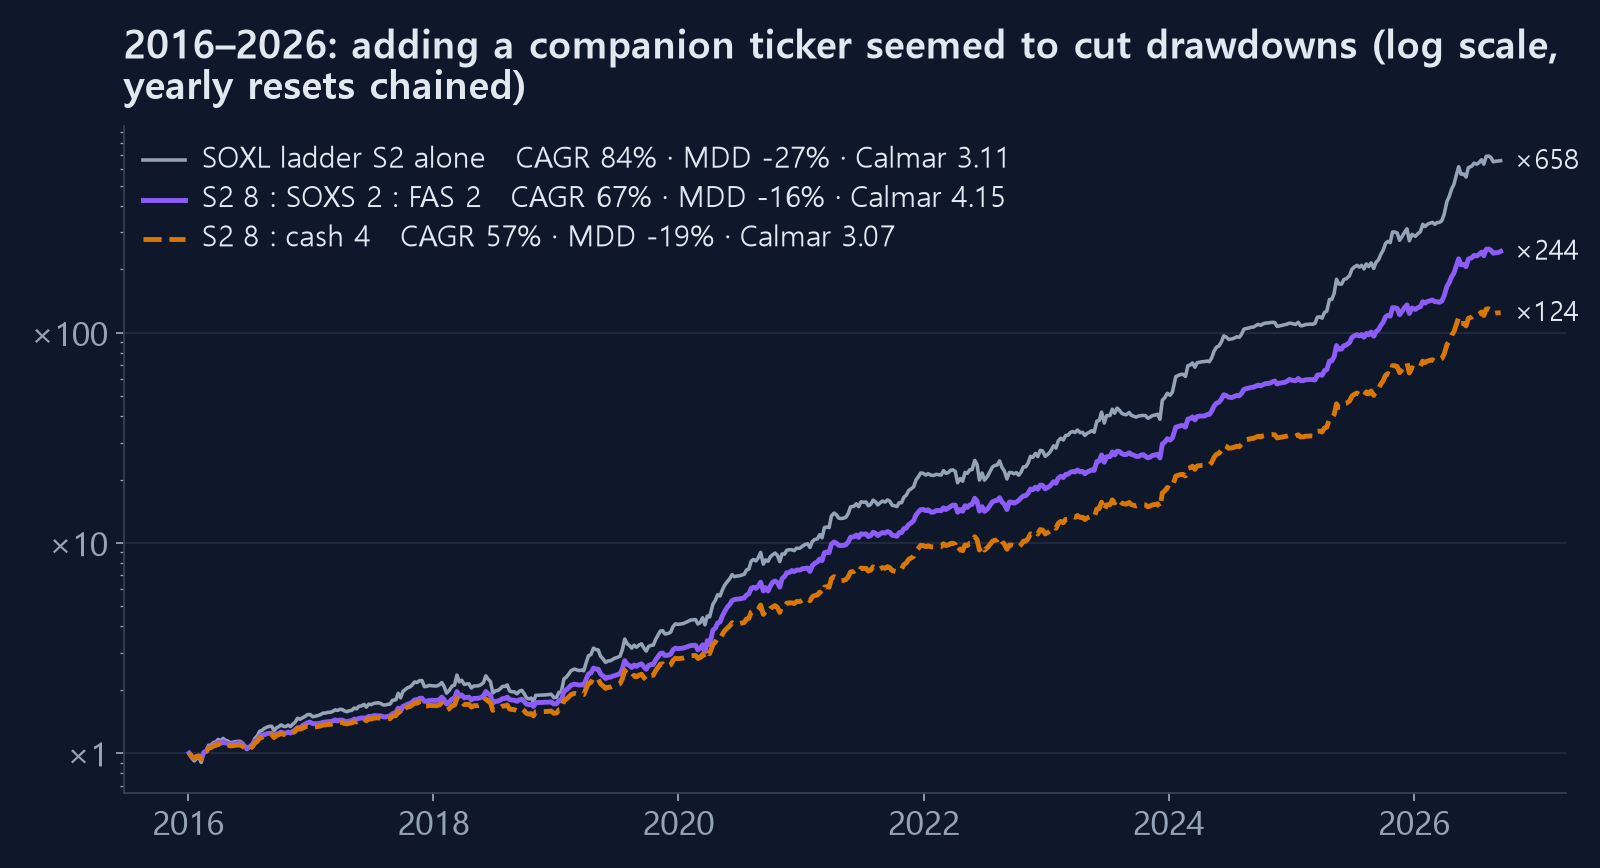
Against the same weight in cash, the three-way mix earned 11 points more per year with a full-period drawdown 2.4 points shallower. Calmar (CAGR ÷ MDD) rose from 3.07 to 4.15. In 2018, when S2 lost 11.6%, the mix lost only 3.6%.
At this point you want to switch on the auto-trader. We did too.
2. Step outside the years the rules were built in
The catch: all six strategies were designed on 2016–2026 data. Looking good inside that window proves little. So we ran the rules without changing a single number on the years before.
SOXS, FAS and NAIL did not exist back then, so we rebuilt them as daily return of the underlying index × leverage − yearly costs. Where the real ETF exists, the index-based version tracks it with a year-to-year return correlation around 0.99.
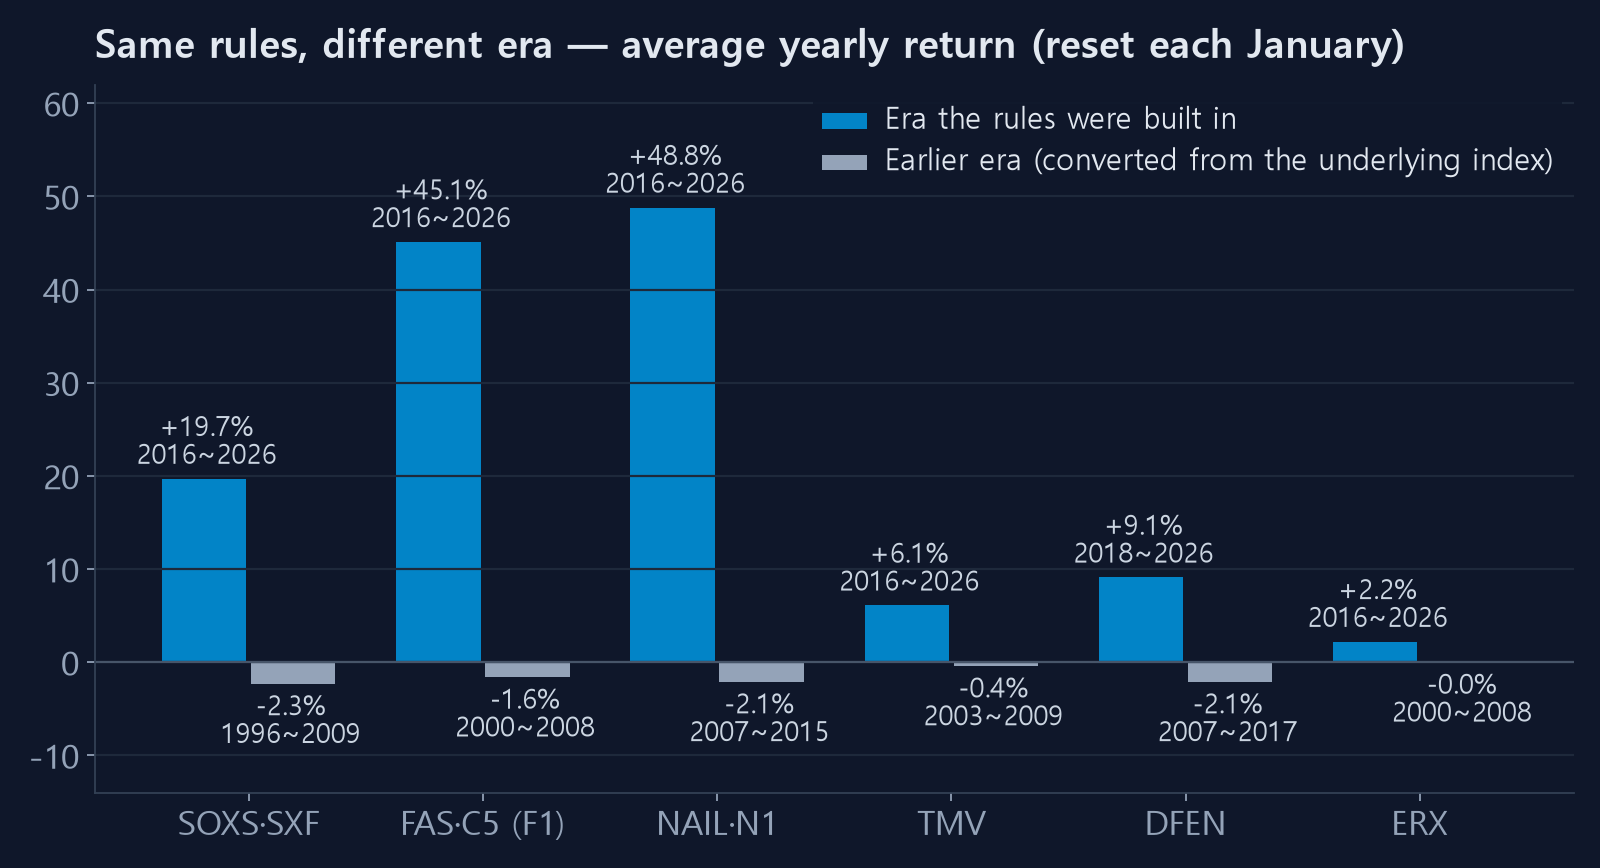
| Strategy | Era it was built in | Avg return / MDD | Earlier era (index-based) | Avg return / MDD |
|---|---|---|---|---|
| SOXS overheat fade | 2016–2026 | 19.7% / −9.6% | 1996–2009 | −2.3% / −22.8% |
| FAS F1 combined | 2016–2026 | 45.1% / −11.2% | 2000–2008 | −1.6% / −27.4% |
| NAIL rate gate | 2016–2026 | 48.8% / −12.2% | 2007–2015 | −2.1% / −42.3% |
| TMV rate-spike dip | 2016–2026 | 6.1% / −4.2% | 2003–2009 | −0.4% / −6.8% |
| DFEN defense dip | 2018–2026 | 9.1% / −11.4% | 2007–2017 | −2.1% / −11.6% |
| ERX energy trend dip | 2016–2026 | 2.2% / −4.2% | 2000–2008 | 0.0% / −4.4% |
All six dropped to roughly zero or below. No exceptions.
3. How they broke, year by year
The averages make it look like "a bit less profit." Spread out by year, it is far worse.
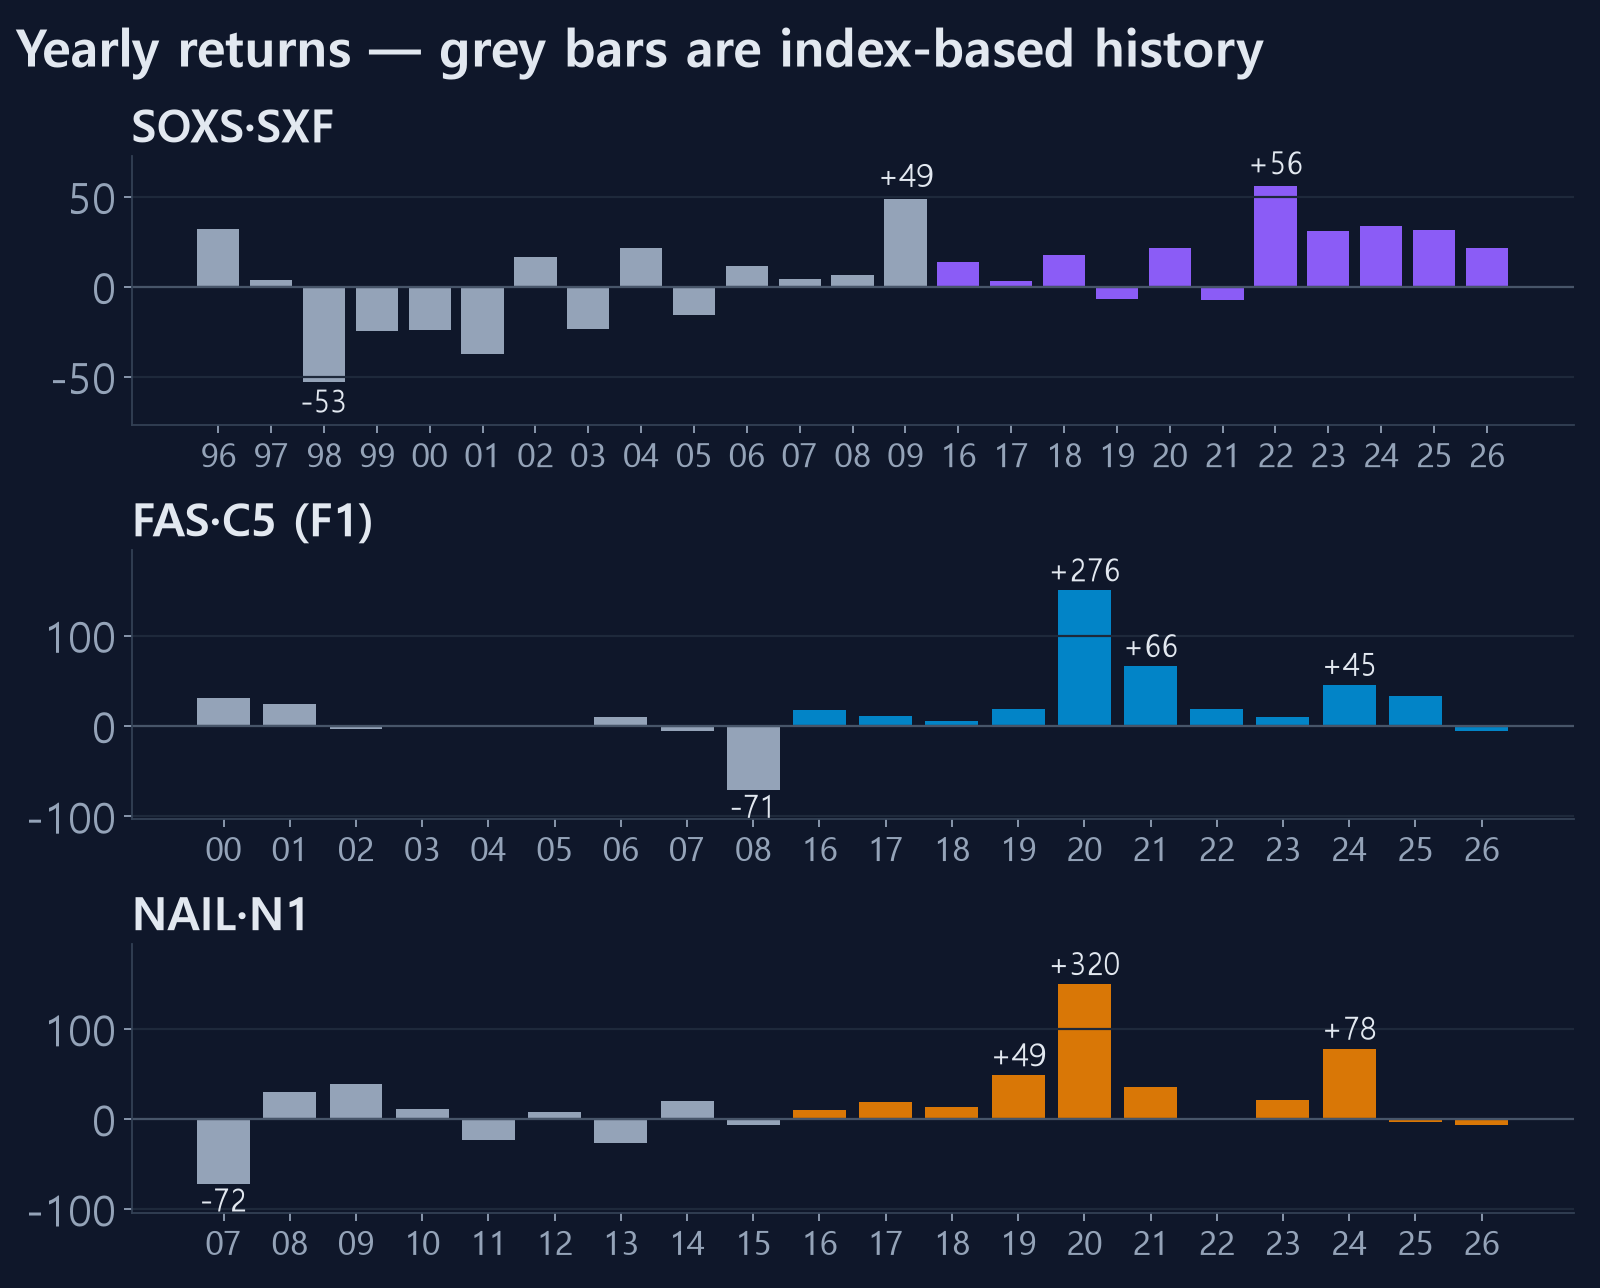
- SOXS strategy: −53% in 1998, −37% in 2001. It buys the inverse ETF when chips look overheated. In the dot-com bubble, "overheated" lasted for months. The quick pull-backs it learned after 2016 simply were not there.
- FAS strategy: −71% in 2008. As rates were cut during the financial crisis, the yield curve steepened, and the strategy read that as a signal to buy the bank rebound. It kept buying falling banks.
- NAIL strategy: −72% in 2007, the year the housing market started to break. Nothing after 2016 looked like that.
These were also SOXL's worst years. At the exact moment a hedge was needed, the hedge lost more. After 2016, crises were short and rate spikes lined up with the chip cycle in a particular way. All six strategies had memorized the shape of that one era.
4. The parameter map makes it obvious
For the best-looking strategy (SOXS), we varied its two key settings, the overheat threshold and the take-profit, and colored the average yearly return.
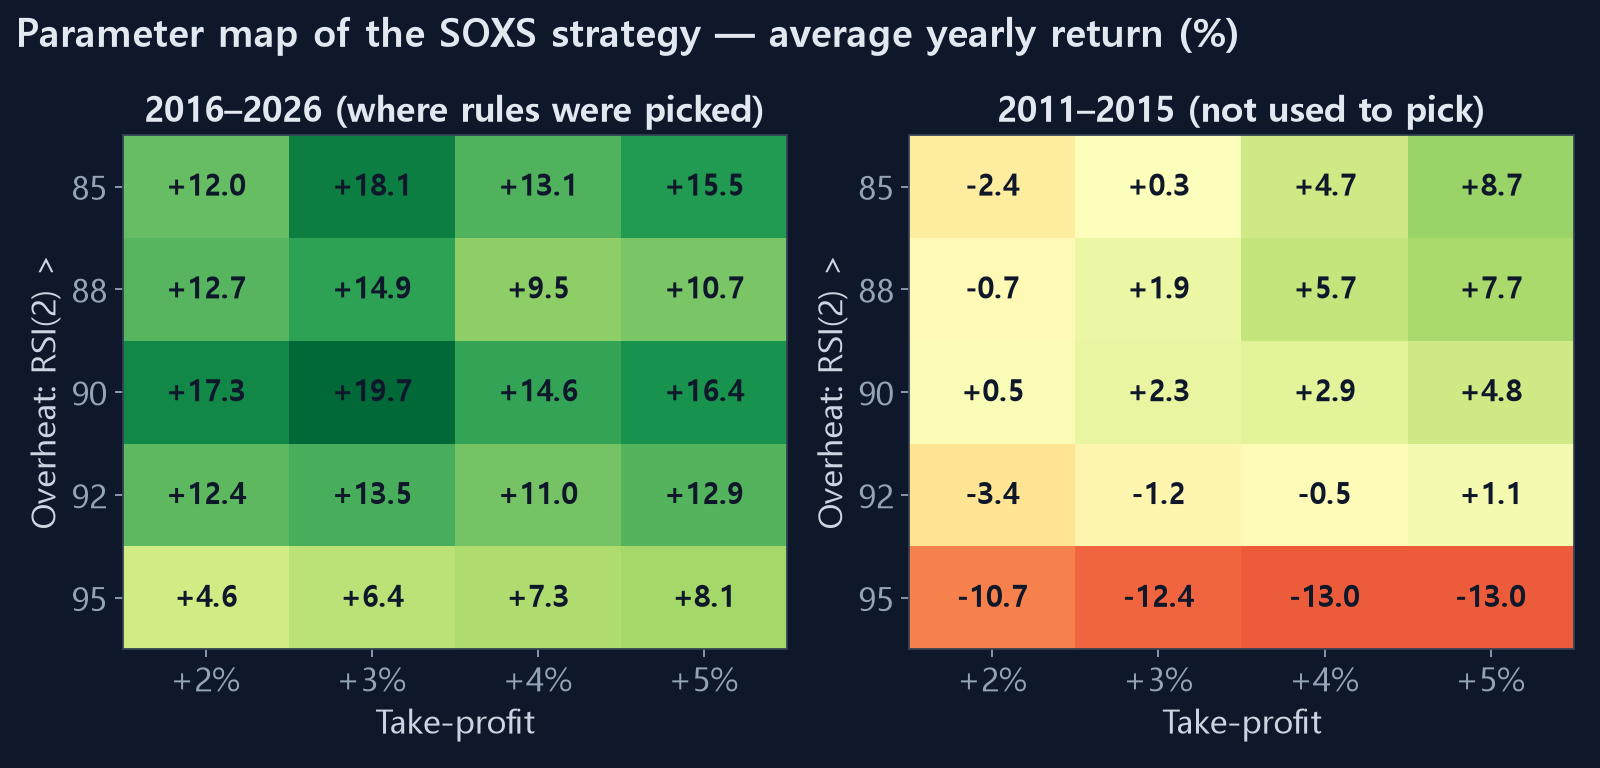
- Left (2016–2026, where the rules were picked): everything is green, and the chosen setting (RSI 90, +3%) sits at the darkest peak.
- Right (2011–2015, not used to pick): mostly near zero, and a slightly higher threshold turns deep red (−13%).
Robust rules sit on a plateau where neighboring settings also work. A lone peak usually means you picked the luck of that period. More in our post on parameter plateaus.
5. Other checks
| Check | Result |
|---|---|
| Rolling walk-forward (pick on 5 years, trade the next 1) | SOXS +1.8% a year / −29% MDD; FAS and NAIL negative before 2009 |
| Against 1,000 random entries | Top ranks only after 2016; indistinguishable from random before |
| Follow the signal one day late | SOXS 19.0% → 9.3%, FAS 35.9% → 13.2% |
| Remove the top 5 trades | SOXS 19.0% → 10.6%, FAS 35.9% → 26.1% |
The tickers we hoped would move against SOXL fell with it, or harder, on the days SOXL truly collapsed. In a crisis, almost every risk asset's correlation goes to one. The "opposite" behavior we saw was a coincidence of an era with short crises.
6. How to check your own backtest for this trap
- Write down the period your rules were built on, then test outside it. Short-lived leveraged ETFs can be rebuilt from the index × leverage. Check the tracking error in the overlap first.
- Draw a parameter map. If your setting is the tip of a peak, that is a warning.
- Trade it one day late. If performance halves, a single delayed fill in live trading can break it.
- Compare against random entries with the same count and holding period. You should clearly beat them.
- For any "covers the bad years" claim, look only at crisis years. Add 2008, 2001–2002 and 2022, index-based if needed. Most hedges vanish right there.
See also walk-forward validation and why backtests look better than reality.
So what about the SOXL strategy itself?
If the partners collapsed, could the SOXL strategies themselves have survived before 2010? SOXL listed in 2010 and has only lived through the best 16 years in chip history. We rebuilt it back to 1996 the same way; the results are in the next post.
Method notes: every order uses signals up to the prior close and fills as a limit-on-close at today's close, with 0.1% commission each way. Index-based ETFs are the daily return of the underlying (^SOX, XLF, ITB, TLT, ITA, XLE) × leverage minus 2–2.5% a year in costs. SOXS was computed with fractional shares because its split-adjusted historical prices are very large. This is not investment advice, and past results do not guarantee future returns.