Source and scope — The Infinite Buying method (무한매수법) was created by the Korean author Laoer and published in his book and his Naver café. Version 4.0 came out in March 2026. The original text is members-only, and in March 2026 the author asked that it not be reworked or redistributed. So this article does not reproduce it. What we tested is our own reconstruction for backtesting, built by reconciling two public secondary sources (the V4.0 summary on quantstack.app and an implementation published on GitHub). For the authoritative rules, please go to the original.
Secondary sources consulted (unofficial): the quantstack.app V4.0 summary, normal mode and reverse mode (unofficial summary); zoehigh/autotrade-basic (open-source implementation)
Infinite Buying buys a 3x ETF such as TQQQ or SOXL a little every day and sells in pieces above the average cost. It is one of the best-known leveraged trading methods in Korea, so we added it to this site's backtest tool as I1 (V4.0, 40 splits) and I2 (V4.0, 20 splits). Before doing that, we checked what numbers it produces and how far those numbers can be trusted. This is the record.
The rules, briefly
- Daily amount and T — Each day's buy is the remaining cash divided by (number of splits − T). T is a counter of how many units have been used; it goes up when buys fill and down when shares are sold.
- Star % and the star price — Star % is a threshold that shrinks as T grows. It starts at 15% for TQQQ and 20% for SOXL, reaches zero halfway through the splits and turns negative after that. Average cost plus star % gives the star price, and both buys and sells are anchored to it.
- First half and second half — Early on, half of each day's amount is bid near the star price and half at the average cost, both as limit-on-close (LOC) orders. In the second half the whole amount is bid near the star price.
- Selling — A quarter of the position is offered at the star price on close; the other three quarters sit in a limit order at average cost +15% (+20% for SOXL). When everything is sold the cycle ends and the whole account starts the next one.
- Reverse mode — Once nearly all units are used, the method shifts from buying to selling: it trims around the last five sessions' average close and buys small amounts below it, returning to normal mode once the price comes back near the average cost.
These are the interpretation choices and daily-bar shortcuts we made. Each can move the results by a few percentage points.
| Item | How the site handles it |
|---|---|
| Fills | LOC fills at the close if the close crosses the limit; the 3/4 sell limit is checked against the daily high |
| Pre- and after-market | Not in daily bars, so not modelled — the backtest sells less than a real account might |
| Splits | Only 20 and 40, the two with a public star % formula (30 left out) |
| Leaving reverse mode | Normal mode resumes the day after the condition is met |
| Rules in one source only | The GitHub version's extra one-share orders are left out; how they change T is not public |
| Other tickers | Anything other than SOXL uses the TQQQ numbers |
| Fees | 0.1% per side |
The engine matched a second simulator, written separately from the spec alone, to within 0.004% of daily equity across 16 combinations of TQQQ, SOXL, UPRO and QQQ, and we traced several days by hand down to order sizes. That still does not guarantee the rules match the original.
2011–2026 results
Each calendar year starts fresh with $10,000, giving 16 separate years; 2026 runs only to September–October. The last column runs the whole period without resetting.
| Avg yearly return | Avg yearly max drawdown | Losing years | Worst year | Continuous CAGR / max DD | |
|---|---|---|---|---|---|
| TQQQ I1 | 15.9% | −17.1% | 2/16 | −29.6% (2022) | 16.7% / −55.0% |
| TQQQ I2 | 19.8% | −21.2% | 1/16 | −42.1% (2022) | 19.1% / −54.3% |
| TQQQ hold | 57.0% | −39.6% | 3/16 | −79.8% (2022) | 39.3% / −81.8% |
| SOXL I1 | 25.2% | −24.6% | 3/16 | −11.7% (2011) | 26.4% / −48.9% |
| SOXL I2 | 29.5% | −31.1% | 2/16 | −13.7% (2022) | 30.9% / −59.1% |
| SOXL hold | 67.1% | −56.4% | 6/16 | −86.6% (2022) | 34.7% / −90.5% |
Two things show up at once. Drawdowns and losing years are clearly smaller than holding — in 2022, when holding TQQQ lost 79.8%, I1 lost 29.6%. But returns are roughly a third of holding, because on average only about 28% (I1) to 35% (I2) of the account is invested; most days it sits in cash.
Note also that the yearly view flatters the drawdown. Run continuously, even TQQQ fell 55% from peak, because some cycles carried losses across year boundaries. (Why max drawdown matters more than return)
1999–2010: dot-com and the financial crisis
TQQQ and SOXL listed in 2010, so earlier prices are synthetic — the index's daily return times three. They are not returns of a real product. (Can synthetic leveraged prices be trusted?)
| 1999–2010 (synthetic) | Avg yearly return | Losing years | Worst year | 12 years continuous |
|---|---|---|---|---|
| TQQQ I1 | about 0% | 5/12 | −65.5% (2002) | −95.4% |
| TQQQ I2 | 0.7% | 5/12 | −72.6% (2001) | −89.8% |
| SOXL I1 | 6.0% | 4/12 | −85.1% (2002) | −78.2% |
| SOXL I2 | 19.8% | 6/12 | −76.5% (2008) | −12.3% |
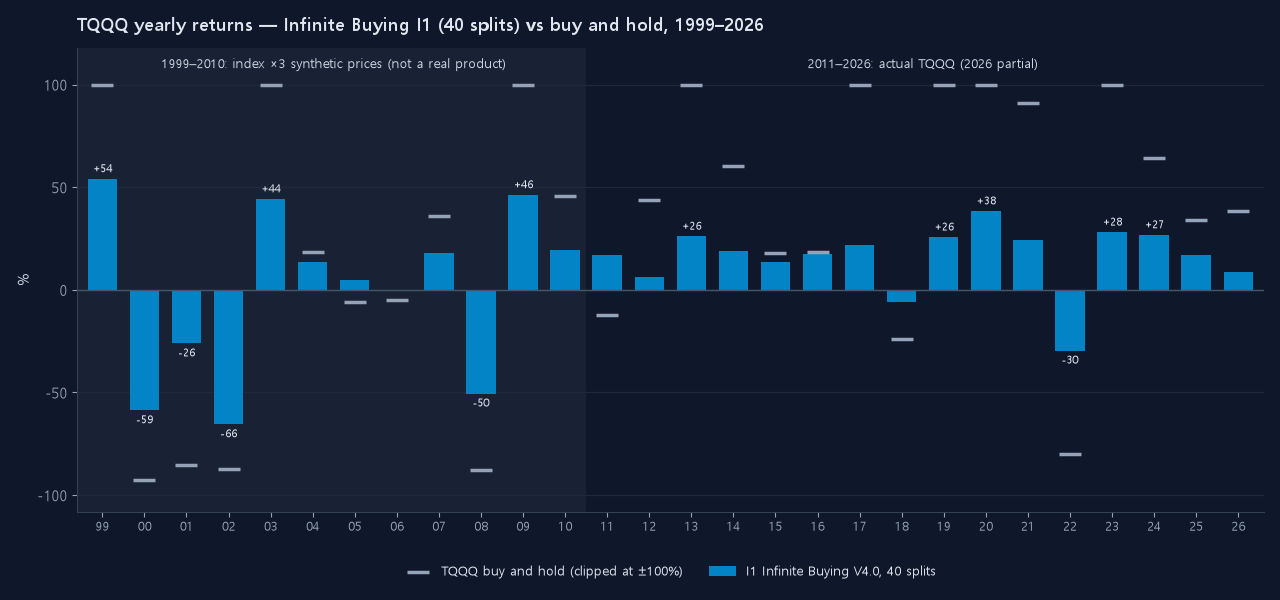
In bear markets that lasted years — 2000–2002 and 2008 — the method used up its units, entered reverse mode, and prices kept falling. The worst years ran from −66% to −85%, and twelve years of continuous TQQQ trading left about 5% of the starting capital. Holding was worse still at −98.7%, but "lost less than holding" is not the same as "survivable". The good 2011–2026 numbers came from inside a long bull market in the Nasdaq and in chips.
Against simpler alternatives
We compared it year by year with plain DCA — buying the same amount every trading day of the year.
| Avg return / avg max DD / losing years | TQQQ | SOXL |
|---|---|---|
| Infinite Buying I1 | 15.9% / −17.1% / 2 | 25.2% / −24.6% / 3 |
| Infinite Buying I2 | 19.8% / −21.2% / 1 | 29.5% / −31.1% / 2 |
| Daily DCA | 24.4% / −24.1% / 3 | 31.5% / −34.7% / 7 |
Lower return than DCA, smaller drawdowns and fewer losing years. On SOXL, cutting losing years from seven to two or three is a real difference.
We also ran a random control: keep the method's day-by-day invested fraction but shift it to a random point in the year, 200 times. The median random run averaged about 10% a year on TQQQ I1 and about 14% on SOXL I1, and the actual method landed on average between the 66th and 77th percentile of the random runs. Better than random at the same level of risk, but not by a wide margin. (This control was run before a small tick-size fix in the engine; the difference is around 1–2 points.)
How robust are the numbers?
- Parameter shake — Moving the sell target (+15%/+20%) and the starting star % by ±15% and ±25% kept the average yearly return within 15.9–17.6% for TQQQ I1, 17.4–20.4% for I2, 23.0–25.9% for SOXL I1 and 26.8–32.2% for I2. The published values are not a peak; the neighbourhood is a flat plateau. (Good parameters sit on a plateau)
- Fees — At 0.3% per side the average yearly return drops 1.6–3.5 points. It trades every day, so turnover is high, and I2 is the more sensitive of the two.
- Other tickers — With the TQQQ numbers, UPRO made 13–14% a year and TECL 17–21%, all below holding. On 1x ETFs such as QQQ and SPY it made 1–4% a year: the method clearly depends on the large swings of a 3x fund.
- Concentration — The top two years account for about 24–32% of the 16-year gain in log terms, so the result does not hinge on a single year.
Bottom line
On past data, Infinite Buying V4.0 cut drawdowns and losing years sharply compared with simply holding a 3x ETF, and paid for it with lower 2011–2026 returns than either holding or DCA. In the multi-year bear markets of the synthetic 1999–2010 period, it broke down as well. Read these numbers as a record of how the rules behaved in different markets, not as a forecast.
You can check it yourself: choose I1 or I2 in the TQQQ backtest and change the dates. Ticker notes are on the TQQQ and SOXL pages, and the site's other strategies are in the strategy guide. If you find a result you like, try to break it out of sample first, as in What to check first when a backtest looks good.