SOXL delivers three times the daily return of a US semiconductor index (ICE Semiconductor). It listed in March 2010 and is among the most volatile tickers available on this site.
Here is how to actually backtest it, in order.
0. Three numbers to know first
Before you start, it helps to know what kind of instrument this is. Measured over sixteen years:
| Value | |
|---|---|
| Underlying (SOXX) annual volatility | 30.9% |
| Average yearly maximum drawdown (buy and hold) | −56.4% |
| Worst year's maximum drawdown | −89.9% |
−89.9% means $10,000 became $1,010. Recovering the original requires an 890% gain.
If you still want to proceed, read on.
1. Choose the wrong period and the result lies
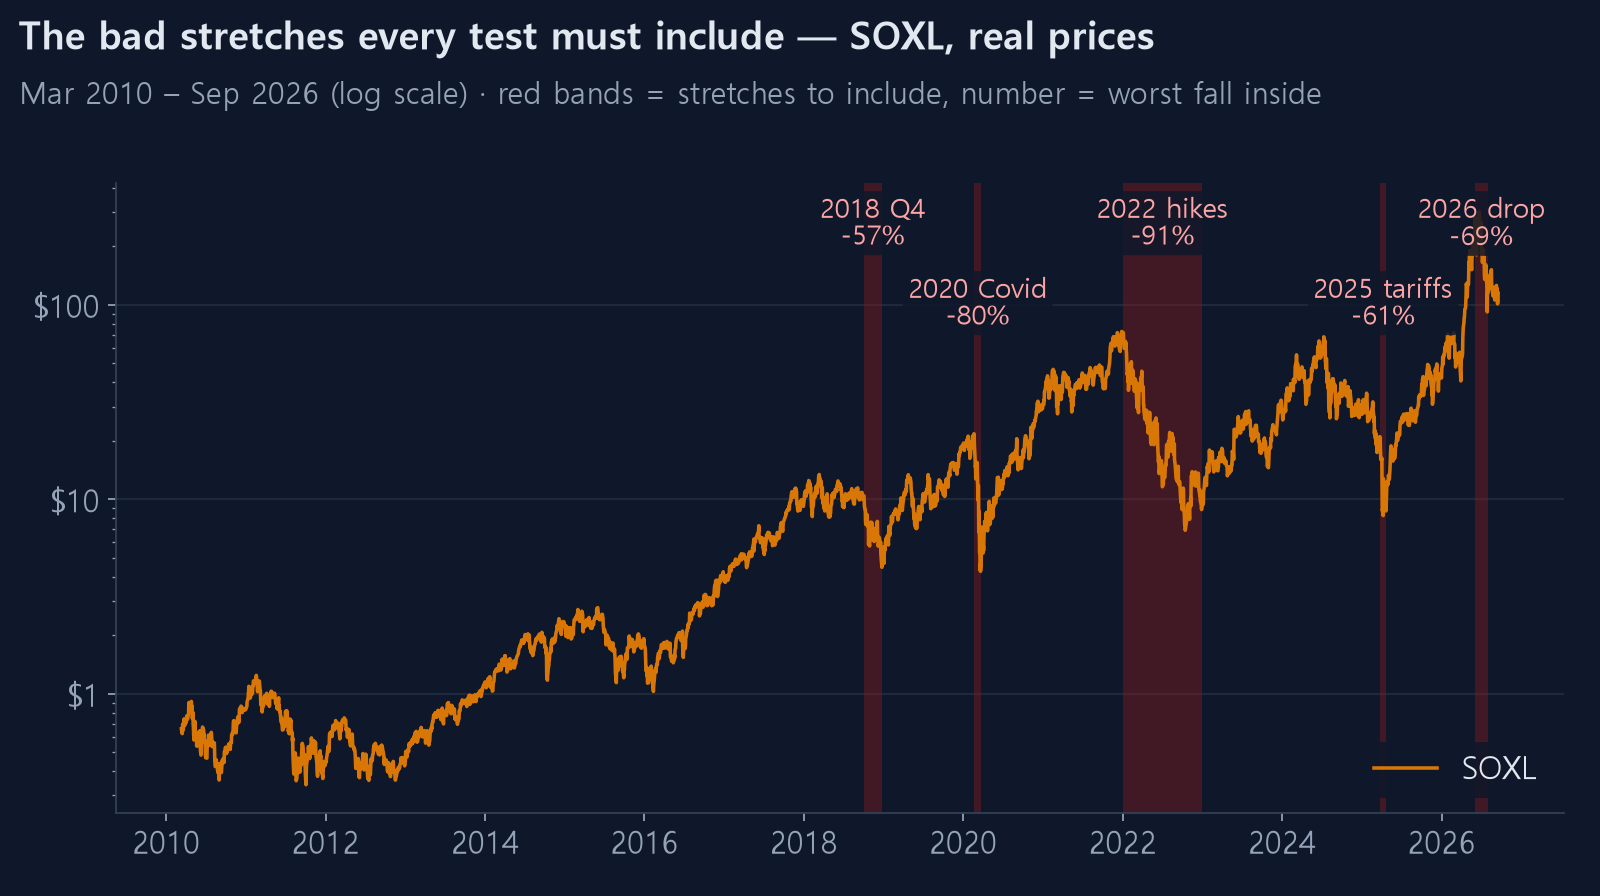
Run SOXL over the last three years and it will look excellent, because 2023–2024 was one of the great semiconductor bull runs. Include the bad years deliberately.
| Period | Semiconductor market |
|---|---|
| Q4 2018 | US–China trade war; short, sharp fall |
| Feb–Mar 2020 | Covid crash and violent recovery |
| All of 2022 | Rate hikes; down for twelve months |
| Apr 2025 | Tariff shock; −40% in days |
| Jun–Jul 2026 | −60% from the high |
The 📅 30-Year Report button breaks results out year by year. Good years and bad years must both be present before a strategy is believable. If one year produced all of the profit, that was a good year, not a good strategy.
There is a quick test: drop the single best year and recompute the average. If it halves, the strategy is essentially that one year.
Real SOXL prices cannot test 2008 — it listed in 2010. Instead, this site fills the years before 2010 with index-based prices built by tripling a 1x semiconductor series (the PHLX Semiconductor Index, then from July 2001 SOXX — called IGW and tracking the S&P GSTI Semiconductor Index until October 2010), so tests can start in 1994. When a result includes that range the screen says so and the 30-year table marks those years "index-based". Treat them as an estimate, not traded prices. (How the index-based history is built and checked)
Run the same A2 strategy over the index-based years (1997–2009), restarting each January, and it averages 30.3% a year with two losing years in thirteen — similar to the real years (31.9%, one losing year in sixteen). But run that stretch continuously and the maximum drawdown is −53%, far deeper than the −36% of running the real years (2010–2026) continuously. Index-based figures can move by 1–2 points a year with the assumptions (dividends, costs, index differences). If you picked a strategy on post-2010 data, give it this second exam. Validating on the 1x version (SOXX) first is still a good habit.
2. Too small a seed means no trades at all
SOXL often trades above $100 a share, and this site buys whole shares only. A $10,000 seed split six ways allocates about $1,000 to the first tranche; if the share price is $1,200, it buys nothing.
A result of "no trades" is almost always this. Raise the seed or reduce the tranche count — seed ÷ tranches should be at least three to five times the share price.
3. Which number to read first
Read maximum drawdown before return. Reverse the order and you will regret it.
Maximum drawdown here is measured on total account value including cash. Split buying keeps cash idle most of the time, so the figure comes out small. Read that as "less exposed to the market" rather than "the strategy prevented the drawdown".
Concretely, A2 Standard on SOXL is actually holding shares on 70.9% of sessions. The other 30% is cash, and cash does not fall.
Then read average holding period and trade count. SOXL with A2 trades roughly 1,900 times over sixteen years with a 4.7-session average hold. That is a strategy highly sensitive to fees and slippage.
Re-run with the fee raised from 0.1% to 0.3% and you will see immediately whether anything survives. If your broker charges more, or FX costs apply, this check is mandatory.
4. Do not be fooled by the win rate
SOXL with A2 has an 80.8% win rate — eight wins in ten.
Drop the profit target to 0.01% and the win rate rises to 86% while the return falls to a quarter. Stretch the time cut to 250 sessions and the win rate becomes 97.7% while maximum drawdown goes to −83%.
Win rate tells you almost nothing about quality. Lower the target or lengthen the wait and you can set it wherever you like; the bill arrives as drawdown. (Why the time cut exists)
5. 3x is a one-day promise
Measured, SOXL's daily tracking multiple is 2.96. The issuer is doing its job.
But over sixteen years the underlying compounded at 23.2%, a naive 3x would be 69.5%, and the actual figure is 35.8% — about half. The entire gap is volatility drag.
Drag scales with the square of volatility. At SOXX's 30.9%, theory predicts 28.6 percentage points a year, against a measured shortfall of 33.7.
So read any SOXL backtest that assumes long holding with care. Strategies that get in and out quickly fit the instrument structurally better.
6. Before trusting the result
Shake the parameters ±20% and run again. Entry trigger −1.0% to −0.8% and −1.2%, profit target 1.5% to 1.2% and 1.8%. If the result swings hard, the setting was fitted to accidents in the past data. (Good parameters sit on a plateau)
And one more. Ask yourself when you decided the rule. If you chose it after seeing the result, that result is not evidence. The method is in what to check first when a backtest looks good.
7. Compare against the other strategies
This site carries several strategy families built for SOXL. ⚡ Compare all loads them at once, and 📊 Compare 30Y lines them up year by year.
Averages on a yearly-reset basis (2010–2026, a fresh $10,000 each year). The numbers come from the same calculation as the strategy guide.
| Strategy | Avg return | Avg MDD | Losing years |
|---|---|---|---|
| A2 Standard | 37.0% | −21.1% | 1 |
| D6 Dual mode, bear guard | 54.6% | −18.3% | 3 |
| B4 Breakout, losing-streak brake | 47.3% | −7.8% | 0 |
| B5 Breakout, brake + release nights | 42.8% | −6.2% | 0 |
| Buy and hold | 65.8% | −56.4% | 6 |
Do not take the B numbers at face value. They trade almost every day, so a little more in fees or slippage cuts the return sharply, and stops before March 2010 (the simulated years) are approximated from daily bars.
Results export as CSV or an image.
The full list of checks is in the pre-live checklist.