Anyone who runs a few backtests starts to wonder:
Don't backtests only look good on stocks that went up? If the chart points down, does any rule actually help?
It sounds right, but when we tested it, it turned out to be only half true. We ran about 34,000 settings on three gold products:
- UGL, a 2x gold ETF
- ACE Gold Futures Leverage (225130), a 2x gold futures ETF listed in Korea
- GDXU, a 3x gold-miner ETN
Here is the most striking result first.
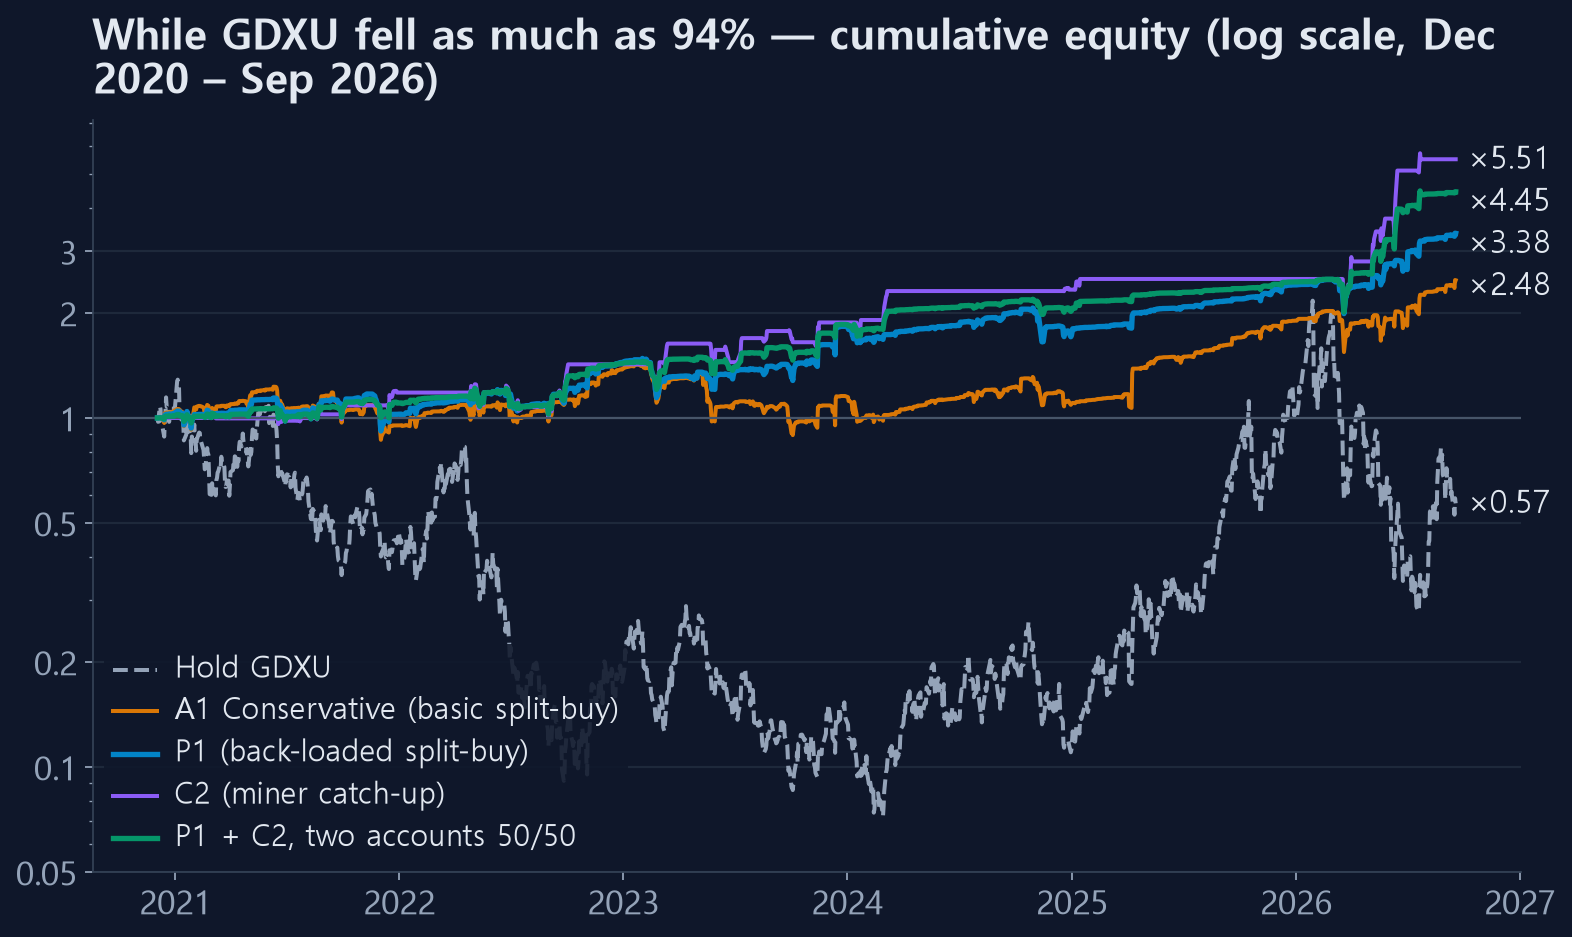
The dashed gray line is GDXU itself. After it listed in December 2020 it fell as much as 94% from its peak, and it still trades at 57% of its first close. Yet the same ETN, traded with a simple buy the dips, sell the bounces split-buy rule, grew an account 2.5 to 5.5 times.
The short answer
- Split-buying makes money from swings, not from direction. It can earn in a falling market as long as the market swings hard.
- In a market that rises quietly and steadily, it badly trails buy-and-hold. An uptrend actually hurt it.
- In a long decline with no bounces, both split-buying and trend following lost.
- So the real question is not "does the chart go up?" but "does this market contain the movement my strategy feeds on?"
The evidence follows.
How we tested
| Item | Detail |
|---|---|
| Products | GDXU (3x gold miners, listed Dec 2020), UGL (2x gold), 225130 (ACE Gold Futures Leverage, KRW) |
| Period | GDXU actual Dec 2020 – Sep 2026, UGL 2009 –, 225130 2015 – |
| Long history | Before GDXU listed, we built it from GDX (1x miners) daily return × 3 − 0.07% a day. The 0.07% is how far real GDXU actually trailed 3×GDX after listing |
| Fills | Every order is a limit-on-close (LOC). Today's order uses only information up to yesterday's close (no look-ahead) |
| Costs | 0.1% per buy and per sell (0.2% for 225130 because it trades thinly) |
| Metric ① | Yearly reset: start fresh with $10,000 every January and average the yearly returns and MDDs (same as this site's 30-Year Report) |
| Metric ② | Continuous compounding: run the whole period without resets and report CAGR and maximum drawdown (MDD) |
You need both metrics, for reasons explained below. The gap between them is large enough to flip a conclusion.
1. The counterexample: 23% a year on a product that fell 94%
We compared four strategies.
- A1 Conservative: this site's default. Six tranches weighted
5, 10, 15, 20, 25, 25. - It buys on any down close, takes profit at +0.01%, and has a 10-day time cut.
- P1:
- It pushes weight toward later tranches,
3, 6, 10, 16, 25, 40. - It buys only on days down 1% or more and takes profit at +2%.
- It keeps the 10-day time cut.
- C2 miner catch-up: a new strategy, explained in section 6.
- P1 + C2: two separate accounts, half the capital each.
| Strategy (GDXU) | Yearly reset: avg return / avg MDD | Compounded CAGR / MDD |
|---|---|---|
| Buy & hold | (years range −62% to +694%) | −9.3% / −94.4% |
| A1 Conservative | +19.0% / −18.8% | +17.0% / −37.4% |
| P1 | +21.7% / −13.8% | +23.4% / −22.8% |
| C2 | +31.8% / −9.2% | +34.3% / −19.5% |
| P1 + C2, two accounts | +26.7% / −10.3% | +29.4% / −19.5% |
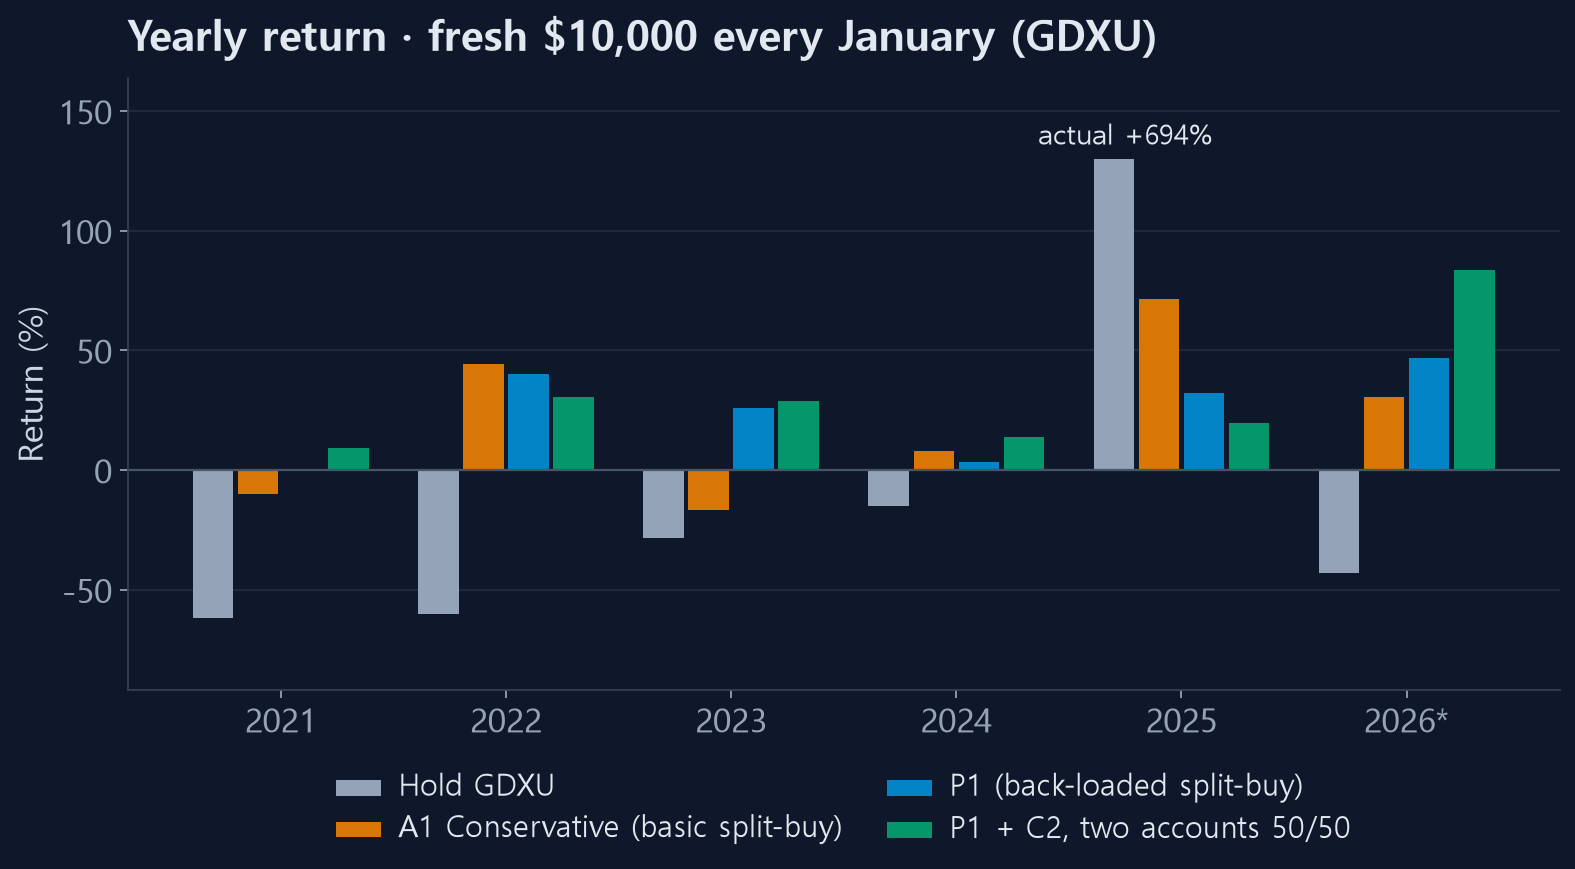
2026 runs through September 18.
GDXU fell four years in a row from 2021 to 2024: −62%, −60%, −28% and −15%. Over the same years P1 returned +0.5%, +40.2%, +26.0% and +3.1%.
Why a falling product can still pay
Break one split-buy cycle into steps:
- On a day that closes down more than 1%, buy one tranche.
- As soon as that tranche bounces 2%, sell it.
- If no bounce comes within 10 trading days, sell anyway, even at a loss.
All it needs is "a 2% bounce at some point within a few days of a drop." Where the price sits a year later does not matter. GDXU's daily return has a standard deviation of about 7%, so 2% bounces kept appearing even in its bear market.
In other words, this strategy is selling volatility, not direction. Its return comes from the size of the swings, not from which way the chart is heading.
2. On rising charts it actually lags
We applied the exact same P1 rule to four markets with different character.
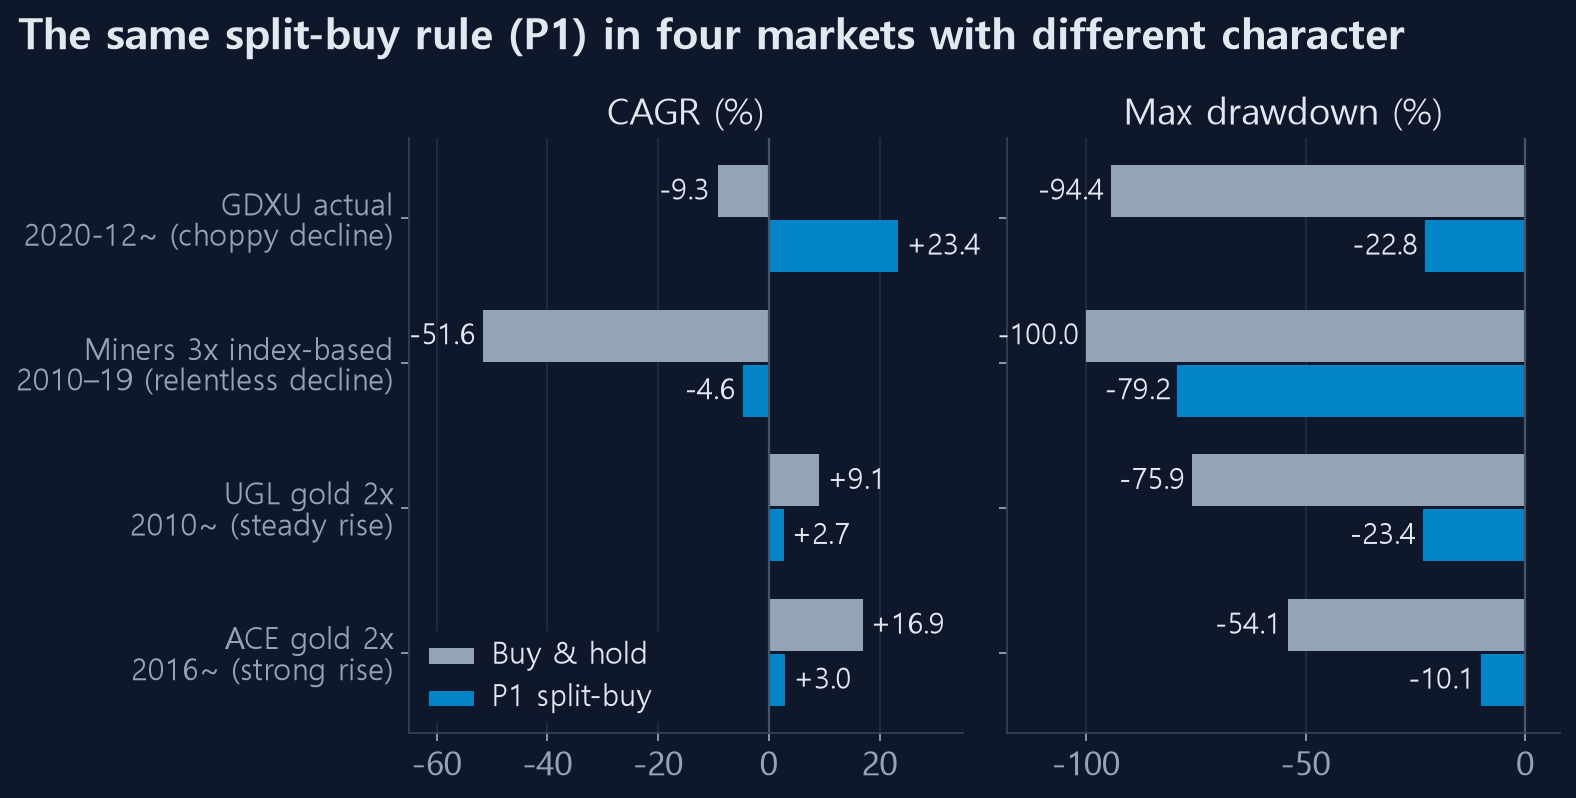
| Market | Character | Buy & hold CAGR / MDD | P1 CAGR / MDD |
|---|---|---|---|
| GDXU actual (Dec 2020 –) | Choppy decline | −9.3% / −94.4% | +23.4% / −22.8% |
| Miners 3x index-based (2010–19) | Decline without bounces | −51.6% / −100% | −4.6% / −79.2% |
| UGL gold 2x (2010 –) | Steady rise | +9.1% / −75.9% | +2.7% / −23.4% |
| 225130 gold 2x (2016 –) | Strong rise | +16.9% / −54.1% | +3.0% / −10.1% |
This was one of gold's strongest stretches in history, and P1 made only about 3% a year on the two rising products. Holding would have earned 3 to 6 times more per year.
The reasons are structural.
- Take-profit is capped at +2%. Even when a 30% rally comes, each tranche collects 2% and leaves.
- Most of the money sits in cash. A 2x gold ETF swings far less than GDXU, so −1% days are rare and the strategy simply buys less often.
- Bull markets often rise quietly, without small dips, which leaves split-buying no room to enter.
Drawdowns did shrink a lot (−76% → −23%), so the rule isn't useless there. But "only use it on stocks that go up" is simply wrong for this strategy.
3. Where it breaks: a long decline with no bounces
So is any falling market fine? Our index-based GDXU for 2010–2019 answers that. The period includes the five-year gold-miner bear market of 2011–2015.
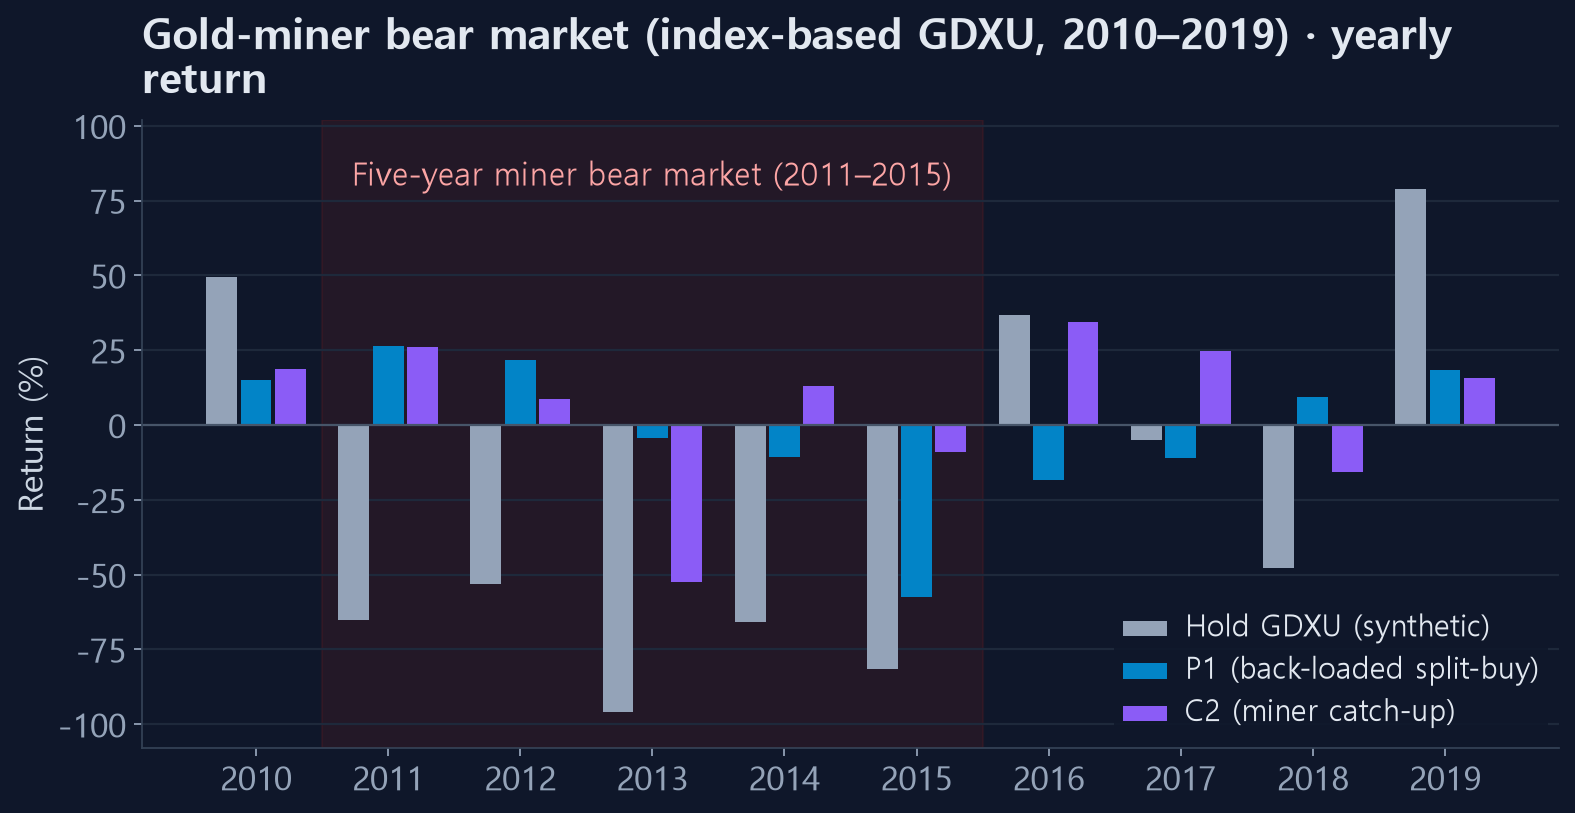
The two halves split cleanly.
- 2011–2012: holding lost 65% and 53%, but P1 made +26% and +22%. Those years fell while swinging hard.
- 2013–2015: holding lost 96%, 66% and 81% in a steady slide without bounces, and P1 fell too: −4%, −11%, and −58%.
The difference is not how far prices fell but how they fell. With no bounces, each tranche never sees its 2% and keeps getting cut at a loss by the 10-day time cut.
On the yearly-reset average this decade looks tolerable at −1.2% / −26%. Run continuously, the MDD is −79%. Starting fresh every year hides back-to-back losses.
4. What about trend following? It really does need direction
We also tested the opposite style: trend following. It sizes the position by the strength of gold's 60-, 120- and 250-day trends and exits when the trend fades.
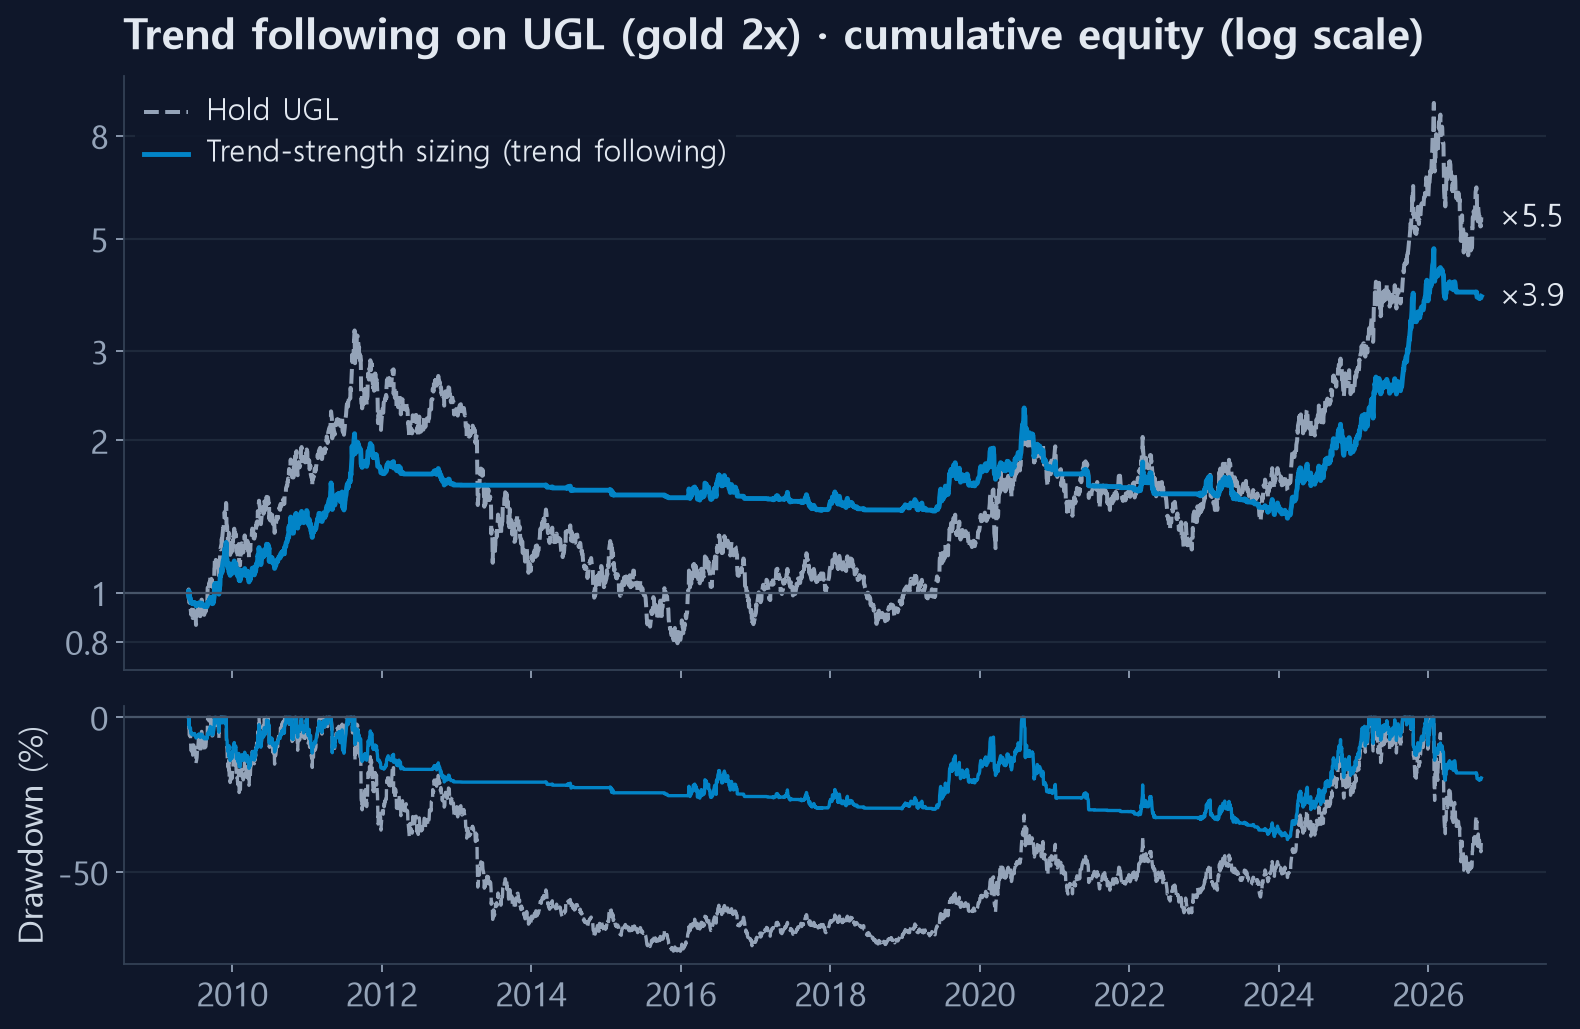
| UGL (2009–2026) | CAGR | MDD |
|---|---|---|
| Buy & hold | +10.4% | −75.9% |
| Trend following | +8.1% | −39.5% |
- It rode the clear trends of 2009–2011 and 2024–2026.
- It got out before the 2013 crash and cut the drawdown in half.
- It earned almost nothing in the directionless 2013–2019 stretch (the flat line), so its return stayed below holding.
- On GDXU the same method made −1.8% a year. The swings were so large that trend signals kept getting faked out.
Trend following genuinely needs direction. It is the mirror image of split-buying.
5. Summary: fit, not "up and to the right"
| Market character | Split-buy (mean reversion) | Trend following | Buy & hold |
|---|---|---|---|
| Falls while swinging hard (GDXU 2021–24) | Best | Poor | Worst |
| Moves sideways while swinging hard | Good | Poor | Average |
| Rises quietly and steadily (UGL, 225130) | Only cuts drawdown | Average | Best |
| Falls without bounces (miners 2013–15) | Poor | Can defend | Worst |
Change the question:
Not "will this stock go up?" but "does this stock have the kind of movement my strategy feeds on?"
Split-buying feeds on volatility and reversals. Trend following feeds on persistent direction. Buy-and-hold feeds on long-run growth. None of them wins everywhere.
6. A new strategy, C2: miners catching up with gold
While looking for a return source different from split-buying, we found one that exists only in gold products.
Gold miners are a leveraged bet on the gold price. When miners fall unusually far behind gold, they have tended to catch up.
The rules:
- Signal: over the last 20 days, 3x the miners' (GDX) return trailed the 2x gold (UGL) return by at least 0.5 in volatility units.
- Also, yesterday's close sat in the bottom 30% of the day's range (a weak finish). When both hold, buy GDXU with 50% of the account.
- If it falls a further 1x volatility below the entry price, buy once more with the remaining 50%.
- Sell after 5 trading days, no matter what.
- If it falls 2.5x volatility below entry, stop out. After two losses in a row, pause for 5 days.
C2 is invested only about 12% of the time, and its daily returns have a correlation of just 0.46 with P1. Running the two in separate accounts therefore lowers drawdown: the average yearly MDD falls from −13.8% to −10.3%, because the two rarely have bad days together. (How diversification shrinks drawdowns)
To be honest about its limits:
- Much of C2's record comes from one year, 2026 (+120%). Without that year, P1 + C2 averages the same return as P1 (20.4%), just with shallower drawdowns.
- It traded only 35 times. Once you account for having picked the best of many settings, it is safer to treat about half of the excess return as luck.
- It did nothing on UGL or 225130. It works only on miners.
7. Practical lessons from 34,000 backtests
① The metric can change the conclusion
A1 on GDXU shows an MDD of −18.8% on the yearly-reset view and −37.4% when run continuously, twice as deep. The yearly-reset table is great for comparing strategies, but the drawdown a real account lives through is the continuous one. Check both. (Three ways to measure return, Why MDD matters)
② Averaging across products hides the signal
At first we looked for one strategy that worked on all three products and ranked by the average. A1, which was excellent on GDXU, disappeared into the average. When each product has a different return source, the average tells you nothing. Evaluate each product separately and always keep the default strategy as a baseline.
③ Don't trust the top setting
- In our first study, the best dip-buying setting on 2009–2019 data made just 1.5% a year after 2020, roughly nothing.
- Re-optimizing every year on past data (walk-forward) did worse than fixing one set of values.
- P1 was chosen from the map below. Anywhere between a −0.75% and −1.25% buy trigger and a 1.5% to 3% take-profit gives 17–22%. Values on a plateau like this are the ones most likely to hold up.
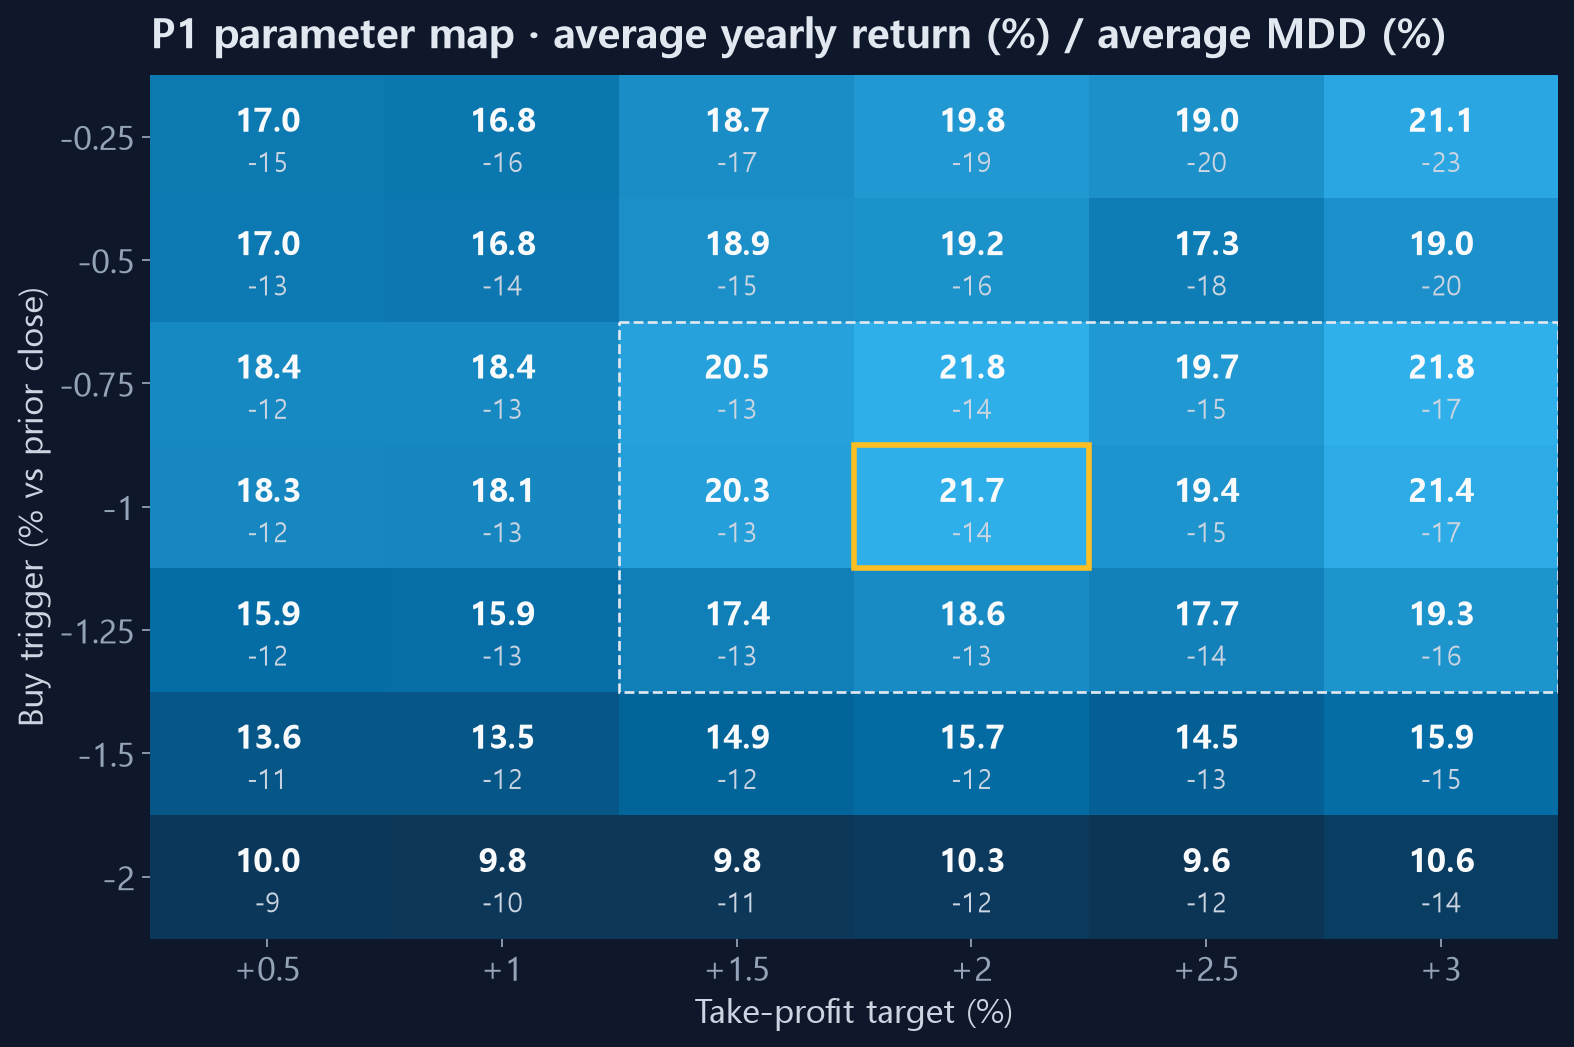
The yellow cell is P1 and the dashed box is the plateau. Bold numbers are average return; small numbers are average MDD. (Good parameters sit on a plateau, Walk-forward validation)
④ Stop-losses and trend filters break split-buying
This ran against intuition.
- Per-tranche stop-losses (−3% to −30%, or volatility multiples) wrecked returns in every setting.
- A "no buying in a downtrend" filter cut GDXU returns from 21.7% to 8.4%.
Buying during declines is split-buying's return source. Manage the risk with the time cut, the weight design and position size, not with stops. (Why use a time cut, Does averaging down work?)
⑤ Heavier later tranches steadily cut drawdowns
We kept the −1% trigger, 2% take-profit and 10-day time cut, and only tilted the weights
further back. The steps went from this site's Defensive preset
(4.8, 9.5, 14.3, 19, 23.8, 28.6), to P1 (3, 6, 10, 16, 25, 40), to an even steeper curve
starting at 2% and ending at 40%. Average MDD fell in one direction — −18.0% → −13.8% →
−11.7% — while returns stayed similar. An effect that moves consistently in one direction is
unlikely to be luck. It comes from buying little on shallow dips and a lot on deep ones.
(Designing tranche weights)
⑥ One year can make the average
Holding GDXU averages about +70% a year on the yearly-reset view, entirely because of 2025 (+694%). C2's average was also lifted by 2026. Check that the result survives without the best year.
Try it yourself
You can run P1 on this site exactly as tested.
👉 Open the GDXU backtest with P1 settings loaded
The link opens the tool with the values below already filled in. To enter them yourself, pick Custom as the tranche style and type the weights separated by commas.
| Input | A1 Conservative (default) | P1 (this article) |
|---|---|---|
| Tranche weights | 5, 10, 15, 20, 25, 25 | Custom · 3, 6, 10, 16, 25, 40 |
| Buy Trigger (%) | −0.01 | −1 |
| Tranche take-profit (%) | 0.01 | 2 |
| Max Hold Days (Timecut) | 10 | 10 |
| GDXU yearly reset, avg (2020–26) | +19.0% / −18.8% | +21.7% / −13.8% |
| GDXU compounded CAGR / MDD | +17.0% / −37.4% | +23.4% / −22.8% |
What to check:
- Click 📅 30-Year Report and compare with A1 year by year. Look especially at 2021 and 2023, when GDXU fell hard.
- Switch the style to Defensive (Bottom-heavy). The weights become less steep, and the average MDD deepens from −13.8% to −18.0% (average return +22.3%). That is lesson ⑤, seen with your own eyes.
- Try the same values on SOXL or TQQQ. How the result changes with each product's volatility is the point of this article.
- The Screener shows at a glance which tickers hit their buy conditions today.
Before trading anything live, go through the backtest-to-live checklist.
Limits and caveats
- Real GDXU data covers just under six years. Everything earlier is index-based and may differ from reality.
- GDXU is an ETN, so it carries issuer credit risk and can be redeemed early. (ETN vs ETF)
- 3x products lose value just from being held. The measured tracking cost was about 17% a year. (Leverage decay, measured)
- 225130 trades only about ₩50 million a day, so large orders will fill at worse prices.
- Expect less than the backtest in live trading. For P1 + C2, a realistic range is 10–20% a year, 10–15% yearly MDD, and a bad year near −30%.
Method note — All orders are assumed to fill as limit-on-close. Signals use only data up to the previous close; we verified mechanically that cutting the data at any date leaves earlier signals unchanged. Trades use whole shares, with a 0.1% fee on each buy and sell. Because US markets close after Korean ones, the 225130 decision on Korean date d uses only US closes before d. About 34,000 settings were tested in total. This is not investment advice.